 Global| Feb 15 2017
U.S. Industrial Production Slips in January on Warmer Weather and Weaker Autos
by:Sandy Batten
|in:Economy in Brief
Summary
Industrial production decreased 0.3% m/m (+0.1% y/y) in January following a downwardly revised 0.6% m/m increase in December. The consensus from the Action Economics Survey had looked for an unchanged reading for total production. In [...]
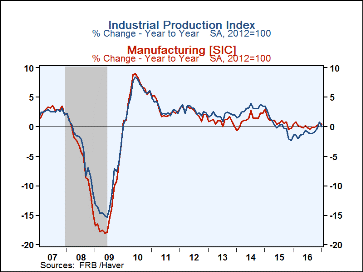
Industrial production decreased 0.3% m/m (+0.1% y/y) in January following a downwardly revised 0.6% m/m increase in December. The consensus from the Action Economics Survey had looked for an unchanged reading for total production. In January, manufacturing output rose 0.2% m/m (+0.4% y/y), and mining output jumped an outsized 2.8% m/m (+0.4% y/y, its first y/y rise since April 2015) with most mining industries reporting increases. The index for utilities fell 5.7% m/m (-2.7% y/y), due mostly to unseasonably warm weather that reduced the demand for heating, and more than reversed the 5.1% m/m jump in December. Note that monthly data throughout 2016 have been revised to reflect updated seasonal adjustment factors.
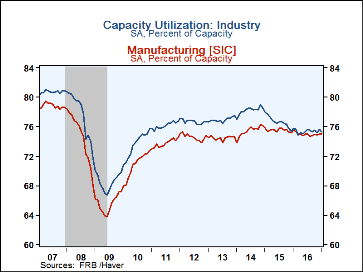
The rate of capacity utilization for total industry fell 0.3%-pt to 75.3% in January against a consensus expectation for a reading of 75.5% (which would have been unchanged from the initially reported December figure). The January figure is 4.6%-pts below its long-run (1972-2016) average. The rate of capacity in manufacturing edged up 0.1%-pt in January to 75.1%. This measure has fluctuated in a relatively narrow range for the past 5 months.
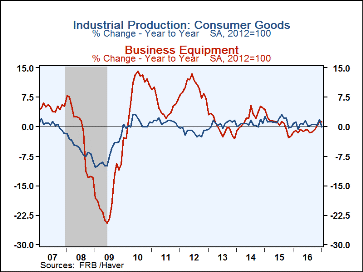
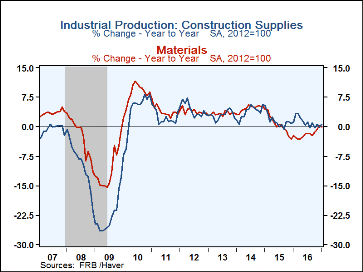
In the factory sector, production was significantly restrained by a 2.9% m/m decline in the output of motor vehicles and parts. Apart from this decline, manufacturing output elsewhere rose a solid 0.5%. And nondurable manufacturing production rose 0.6% m/m, led by textiles and chemicals. Production of consumer goods slipped 0.8% m/m (-0.1% y/y) in January following a 1.4% m/m jump in December. The January decline reflected a drop in both consumer energy products (-6.5% m/m) and consumer durables (again led by auto weakness). Production of business equipment edged up 0.1% m/m (1.2% y/y) on top of a 0.8% m/m gain in December. Output of transit equipment fell 1.5% m/m while production of IT equipment jumped 1.0% m/m. And production of construction supplies jumped 0.9% m/m (0.6% y/y) after having fallen 0.5% m/m in December.
The drop in materials output in January was dominated by a 1.4% m/m decline in production of energy, offsetting a 1.4% m/m rise in December. Output of non-energy materials rose 0.5% m/m after a 0.3% m/m decline in December.
In the special industrial output groupings, output in high-technology industries was unchanged m/m in January following a 0.7% m/m increase in December. Output excluding that in high-tech industries was up 0.3% m/m in January on top of a 0.1% m/m increase in December.
Industrial production and capacity data are included in Haver's USECON database, with additional detail in the IP database. The expectations figure is in the AS1REPNA database.
| Industrial Production (SA, % Change) | Jan | Dec | Nov | Jan Y/Y | 2016 | 2015 | 2014 |
|---|---|---|---|---|---|---|---|
| Total Output | -0.3 | 0.6 | -0.2 | 0.1 | -1.0 | 0.3 | 2.9 |
| Manufacturing | 0.2 | 0.2 | 0.0 | 0.4 | 0.1 | 0.8 | 1.3 |
| Consumer Goods | -0.8 | 1.4 | -0.9 | -0.1 | 0.7 | 1.4 | 0.7 |
| Business Equipment | 0.1 | 0.8 | -0.5 | 1.2 | -089 | 0.7 | 2.4 |
| Construction Supplies | 0.9 | -0.5 | 0.8 | 0.6 | 1.1 | 1.5 | 3.7 |
| Materials | -0.2 | 0.2 | 0.0 | -0.1 | -2.0 | 0.5 | 4.7 |
| Utilities | -5.7 | 5.1 | -2.5 | -2.7 | -0.2 | -0.7 | 1.3 |
| Mining | 2.8 | -1.4 | 0.2 | 0.4 | -9.3 | -1.8 | 11.0 |
| Capacity Utilization (%) | 75.3 | 75.6 | 75.2 | 75.7 | 75.4 | 76.7 | 78.2 |
| Manufacturing | 75.1 | 75.0 | 74.9 | 75.5 | 75.0 | 75.5 | 75.4 |
Sandy Batten
AuthorMore in Author Profile »Sandy Batten has more than 30 years of experience analyzing industrial economies and financial markets and a wide range of experience across the financial services sector, government, and academia. Before joining Haver Analytics, Sandy was a Vice President and Senior Economist at Citibank; Senior Credit Market Analyst at CDC Investment Management, Managing Director at Bear Stearns, and Executive Director at JPMorgan. In 2008, Sandy was named the most accurate US forecaster by the National Association for Business Economics. He is a member of the New York Forecasters Club, NABE, and the American Economic Association. Prior to his time in the financial services sector, Sandy was a Research Officer at the Federal Reserve Bank of St. Louis, Senior Staff Economist on the President’s Council of Economic Advisors, Deputy Assistant Secretary for Economic Policy at the US Treasury, and Economist at the International Monetary Fund. Sandy has taught economics at St. Louis University, Denison University, and Muskingun College. He has published numerous peer-reviewed articles in a wide range of academic publications. He has a B.A. in economics from the University of Richmond and a M.A. and Ph.D. in economics from The Ohio State University.
More Economy in Brief
 Global| Feb 05 2026
Charts of the Week: Balanced Policy, Resilient Data and AI Narratives
by:Andrew Cates


