 Global| Sep 24 2020
U.S. Initial Unemployment Insurance Claims Edge Higher But Other Unemployment Insurance Measures Continue Downtrend
Summary
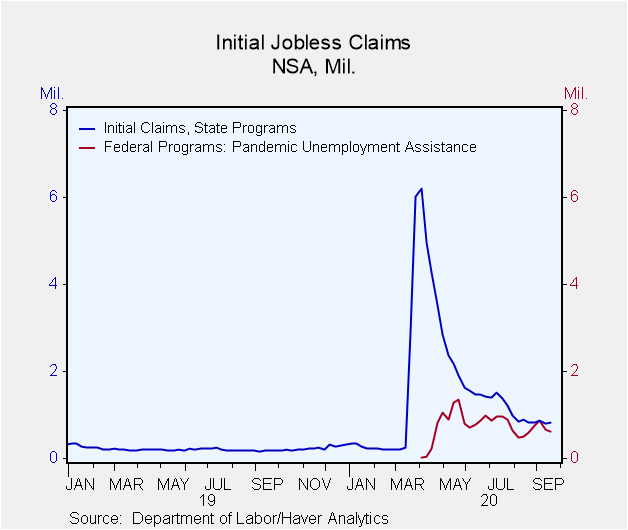
• Seasonally adjusted initial claims in state programs edged up 4,000 in September 19 week to 870,000; not seasonally adjusted claims rose 29,000 to 825,000. • PUA program initial claims fell 45,074 to lowest in four weeks. • Insured [...]
• Seasonally adjusted initial claims in state programs edged up 4,000 in September 19 week to 870,000; not seasonally adjusted claims rose 29,000 to 825,000.
• PUA program initial claims fell 45,074 to lowest in four weeks.
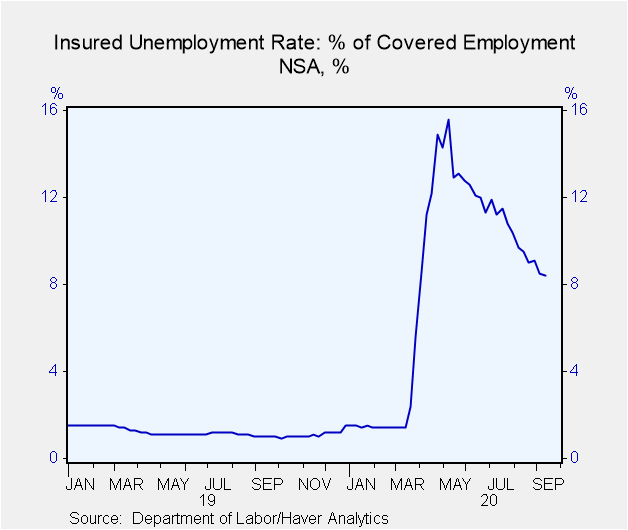
• Insured unemployment rate in Sept 12 week was 8.6%, lowest since 8.2% in early April.
Initial claims for unemployment insurance in standard state programs rose slightly in the week ended September 19 to 870,000 seasonally adjusted (+305% y/y) from 866,000 the week before; that September 12 figure was revised upward by 6,000. The Action Economics Forecast Survey had expected 850,000.
As noted here in recent weeks, the Department of Labor shifted the seasonal adjustment calculation from a multiplicative factor to an additive factor in the week of August 29, which introduced a break in the series then. See the commentary here on September 3 for more information about this change. As we have mentioned here, Haver has calculated a series with additive seasonal factors throughout history; the official Labor Department series will be reconciled when standard adjustments are made in January. Not seasonally adjusted data rose in the September 19 week to 824,500 initial claims from 796,000 the week before.
The special pandemic-related initial claims series fell by 45,000 in the September 19 week to 630,000 from 675,000 the week before; the earlier week was revised from 659,000. This program reaches “gig workers” or others unemployed who are not ordinarily associated with companies or other organizations giving them access to standard unemployment insurance.
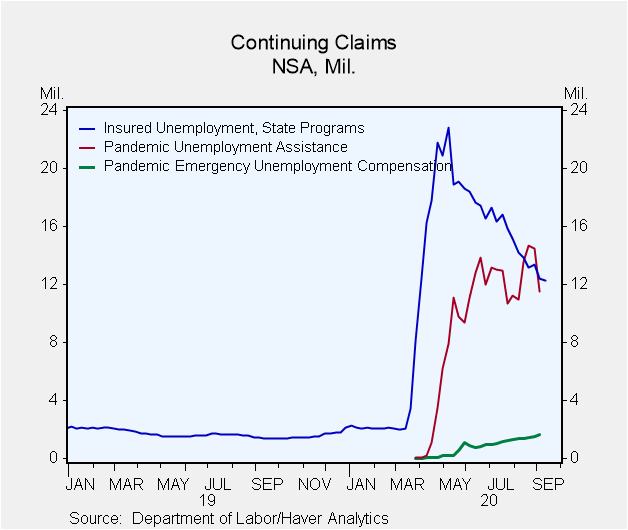
Continuing claims for standard unemployment insurance were 12.580 million in the September 12 week, down 167,000 from the prior week. This extends a downtrend that has persisted – albeit a bit irregularly – since early May. Pandemic Unemployment Assistance program (PUA) continuing claims decreased 2.96 million in the September 5 week to 11.5 million, the lowest since August 8. Pandemic Emergency Unemployment Compensation (PEUC) recipients were still increasing in the September 5 week to 1.632 million from 1.527 million the week before.
The insured unemployment rate was 8.6% in the September 12 week, a downtick from 8.7% the previous week. This includes the standard state programs only. While this is the lowest since 8.2% in the April 4 week, the pre-pandemic “normal” amount was 1.2%.
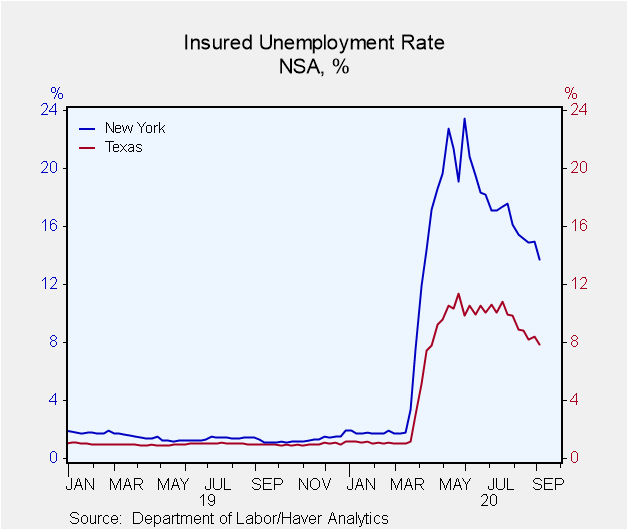
Among the states, the basic insured unemployment rates continue with extreme variation. Alabama, for instance, had a rate of 2.1% in the September 5 week, while Nevada’s was 15.7%. The rate in Texas was 7.9%, Connecticut, 10.1%, and New York, 13.7%. A total of 12 states had rates above 10%.
Data on weekly unemployment claims going back to 1967 are contained in Haver's WEEKLY database, and they are summarized monthly in USECON. Data for individual states are in REGIONW. The expectations figure is from the Action Economics Forecast Survey, carried in the AS1REPNA database.
| Unemployment Insurance (SA, 000s) | 09/19/20 | 09/12/20 | 09/05/20 | Y/Y % | 2019 | 2018 | 2017 |
|---|---|---|---|---|---|---|---|
| Initial Claims | 870 | 866 | 893 | 305 | 218 | 221 | 244 |
| Initial Claims (NSA) | 825 | 796 | 866 | 370 | 218 | 221 | 243 |
| Initial Claims Pandemic Unemployment Assistance (NSA) | 630 | 675 | 868 | -- | -- | -- | -- |
| Continuing Claims | -- | 12,580 | 12,747 | 652 | 1,701 | 1,756 | 1,961 |
| Continuing Claims (NSA) | -- | 12,264 | 12,441 | 776 | 1,704 | 1,763 | 1,964 |
| Continuing Claims Pandemic Unemployment Assistance (NSA) | -- | -- | 11,511 | -- | -- | -- | -- |
| Insured Unemployment Rate (%) | -- | 8.6 | 8.7 |
1.2 |
1.2 | 1.2 | 1.4 |
Carol Stone, CBE
AuthorMore in Author Profile »Carol Stone, CBE came to Haver Analytics in 2003 following more than 35 years as a financial market economist at major Wall Street financial institutions, most especially Merrill Lynch and Nomura Securities. She had broad experience in analysis and forecasting of flow-of-funds accounts, the federal budget and Federal Reserve operations. At Nomura Securities, among other duties, she developed various indicator forecasting tools and edited a daily global publication produced in London and New York for readers in Tokyo. At Haver Analytics, Carol was a member of the Research Department, aiding database managers with research and documentation efforts, as well as posting commentary on select economic reports. In addition, she conducted Ways-of-the-World, a blog on economic issues for an Episcopal-Church-affiliated website, The Geranium Farm. During her career, Carol served as an officer of the Money Marketeers and the Downtown Economists Club. She had a PhD from NYU's Stern School of Business. She lived in Brooklyn, New York, and had a weekend home on Long Island.
More Economy in Brief
 Global| Feb 05 2026
Charts of the Week: Balanced Policy, Resilient Data and AI Narratives
by:Andrew Cates


