 Global| Sep 07 2016
U.S. JOLTS: Labor Market Remains Robust in July
by:Sandy Batten
|in:Economy in Brief
Summary
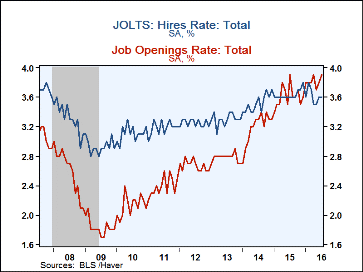
The total job openings rate edged higher to 3.9% in July, regaining its record high last reached in April, up from 3.8% in June and 3.7 in May. The private sector job openings rate jumped to 4.2% in July from 4.0% in June, also [...]
The total job openings rate edged higher to 3.9% in July, regaining its record high last reached in April, up from 3.8% in June and 3.7 in May. The private sector job openings rate jumped to 4.2% in July from 4.0% in June, also regaining its record high. The private-sector performance in July stands in contrast to the government sector, where the job openings rate was unchanged at 2.3%. The Bureau of Labor Statistics reports these figures in its Job Openings & Labor Turnover Survey (JOLTS).
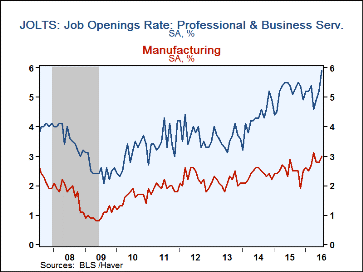
The jobs opening rate increased across all major sectors except for education and health services and was led by a 0.7%-point jump to 5.9% in professional and business services. The factory sector's 3.0% rate was accompanied by 3.1% rate in construction. The job openings rate is the number of job openings on the last business day of the month as a percent of total employment plus job openings.
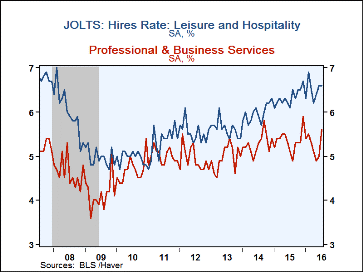
The total hires rate was unchanged at 3.6% in July, but that was still below December's 3.8%. The private sector rate edged up to 4.0% from 3.9% but remained shy of the 4.2% it had reached in February. The total hires rate in the government sector edged up to 1.7% from 1.6% in June. Again, hiring in professional and business services experienced a big jump with construction also posting an outsize monthly gain, while the remaining sectors generally posted either no change or a small decline. A 2.2% rate in manufacturing compared to 5.0% in construction. The hires rate is the number of hires during the month divided by employment.
The actual number of job openings jumped 4.0% m/m (1.4% y/y) to 5.871 million in July following a 2.3% rise in June. Private-sector openings were up 4.8% m/m while government openings slipped 2.7% m/m. Double-digit monthly percentage increases in professional and business services and in construction led the overall rise in private sector openings.
The number of hires increased 1.0% (2.8% y/y) to 5.227 million in July. This was the second consecutive monthly increase after three consecutive monthly declines. Private sector hiring slowed to 1.0% m/m in July, while government hiring picked up, rising declined 2.5%m/m in July. Again, double-digit percentage increases in construction and professional and business services led the overall monthly gain.
The total job separations rate was unchanged at 3.4% in July, down from its cycle high of 3.6% in February. The actual number of separations eased 0.5% m/m (+3.0% y/y) to 4.937 million. Professional and business services exhibited the largest percentage gain in separations in July (+9.2% m/m) while separations in the education and health services sector fell 5.2% m/m in July. Government separations fell 7.1% m/m in July. Separations include quits, layoffs, discharges, and other separations as well as retirements.
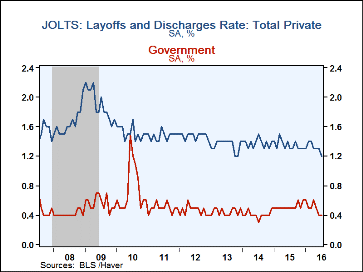
The layoff and discharge rate remained at its record low of 1.1% in July. The private sector rate slipped to 1.2% from 1.3% in June, while the government rate was unchanged at 0.4%. Private-sector layoffs fell 2.9% m/m (-4.4% y/y), and government layoffs rose 2.1% m/m (-15.9% y/y).
Large numbers of hires and separations occur every month throughout the business cycle. Net employment change results from the relationship between hires and separations. When the number of hires exceeds the number of separations, employment rises, even if the hires level is steady or declining. Conversely, when the number of hires is less than the number of separations, employment declines, even if the hires level is steady or rising. Over the 12 months ending in July, hires totaled 62.5 million and separations totaled 60.0 million, yielding a net employment gain of 2.5 million. These totals include workers who may have been hired and separated more than once during the year.
The JOLTS survey dates to December 2000 and the figures are available in Haver's USECON database.
| JOLTS (Job Openings & Labor Turnover Survey, SA) | Jul | Jun | May | Jul '15 | 2015 | 2014 | 2013 |
|---|---|---|---|---|---|---|---|
| Job Openings, Total | |||||||
| Rate (%) | 3.9 | 3.8 | 3.7 | 3.9 | 3.6 | 3.3 | 2.7 |
| Total (000s) | 5,871 | 5,643 | 5,514 | 1.4% | 9.7% | 28.7% | 4.6% |
| Hires, Total | |||||||
| Rate (%) | 3.6 | 3.6 | 3.5 | 3.6 | 43.6 | 42.2 | 39.6 |
| Total (000s) | 5,227 | 5,172 | 5,047 | 2.8% | 5.2% | 8.2% | 3.5% |
| Layoffs & Discharges, Total | |||||||
| Rate (%) | 1.1 | 1.1 | 1.2 | 1.2 | 14.9 | 14.7 | 14.7 |
| Total (000s) | 1,579 | 1,622 | 1,701 | -5.1% | 2.7% | 2.4% | -5.3% |
Sandy Batten
AuthorMore in Author Profile »Sandy Batten has more than 30 years of experience analyzing industrial economies and financial markets and a wide range of experience across the financial services sector, government, and academia. Before joining Haver Analytics, Sandy was a Vice President and Senior Economist at Citibank; Senior Credit Market Analyst at CDC Investment Management, Managing Director at Bear Stearns, and Executive Director at JPMorgan. In 2008, Sandy was named the most accurate US forecaster by the National Association for Business Economics. He is a member of the New York Forecasters Club, NABE, and the American Economic Association. Prior to his time in the financial services sector, Sandy was a Research Officer at the Federal Reserve Bank of St. Louis, Senior Staff Economist on the President’s Council of Economic Advisors, Deputy Assistant Secretary for Economic Policy at the US Treasury, and Economist at the International Monetary Fund. Sandy has taught economics at St. Louis University, Denison University, and Muskingun College. He has published numerous peer-reviewed articles in a wide range of academic publications. He has a B.A. in economics from the University of Richmond and a M.A. and Ph.D. in economics from The Ohio State University.


