 Global| Oct 22 2009
U.S. Leading Economic Indicators Increase For Sixth Straight Month
by:Tom Moeller
|in:Economy in Brief
Summary
The Conference Board's Index of Leading Economic Indicators suggested pending economic recovery with a 1.0% September increase that was the sixth consecutive monthly rise. The 5.7% increase during those six months was the strongest [...]
The Conference Board's Index of Leading Economic Indicators suggested pending economic recovery with a 1.0% September increase that was the sixth consecutive monthly rise. The 5.7% increase during those six months was the strongest since early-1983 and the index itself was at the highest level since October 2007. The leading index is based on actual reports for eight economic data series. The Conference Board initially estimates two series, orders for consumer goods and orders for capital goods.
The breadth of the increase amongst the component series was impressive last month. Eighty percent of the components rose, led by a steeper yield curve, higher consumer expectations, lower initial claims for jobless insurance and higher stock prices. These gains were offset slightly by shorter weekly hours worked and lower building permits.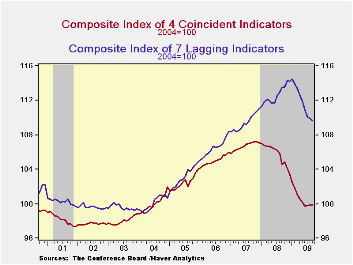
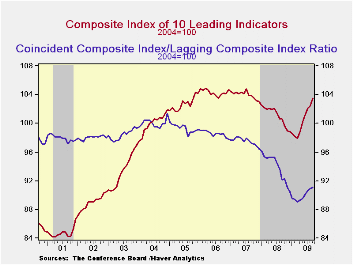
Continuing to suggest that the rate of decline in the economy is slowing were the coincident indicators. They were unchanged during September after a modest 0.1% August gain. These declines compare with monthly shortfalls of 0.6%-to-1.1% dating back to September. Fostering the turnaround have been slight increases in industrial production, real personal income and higher business sales, as well as diminished monthly declines in payrolls.
In a continued sign that excesses in the U.S. economy are falling, the lagging index fell for the ninth month in the last ten. Commercial and industrial loans outstanding fell sharply for the tenth straight month and consumer credit versus personal income was off for the sixth month this year. Regardless, the average duration of unemployment shortened and the change in CPI for services eased. The ratio of coincident-to-lagging indicators (a measure of economic excess) also continued higher for the sixth straight month to the highest level since November.The Conference Board figures are available in Haver's BCI database. Visit the Conference Board's site for coverage of leading indicator series from around the world.
| Business Cycle Indicators (%) | September | August | July | June 6-Month % (AR) | 2008 | 2007 | 2006 |
|---|---|---|---|---|---|---|---|
| Leading | 1.0 | 0.4 | 1.0 | 11.8 | -2.8 | -0.3 | 1.5 |
| Coincident | 0.0 | 0.1 | 0.1 | -2.2 | -0.9 | 1.6 | 2.5 |
| Lagging | -0.3 | -0.2 | -0.6 | -6.4 | 2.9 | 2.8 | 3.3 |

Tom Moeller
AuthorMore in Author Profile »Prior to joining Haver Analytics in 2000, Mr. Moeller worked as the Economist at Chancellor Capital Management from 1985 to 1999. There, he developed comprehensive economic forecasts and interpreted economic data for equity and fixed income portfolio managers. Also at Chancellor, Mr. Moeller worked as an equity analyst and was responsible for researching and rating companies in the economically sensitive automobile and housing industries for investment in Chancellor’s equity portfolio. Prior to joining Chancellor, Mr. Moeller was an Economist at Citibank from 1979 to 1984. He also analyzed pricing behavior in the metals industry for the Council on Wage and Price Stability in Washington, D.C. In 1999, Mr. Moeller received the award for most accurate forecast from the Forecasters' Club of New York. From 1990 to 1992 he was President of the New York Association for Business Economists. Mr. Moeller earned an M.B.A. in Finance from Fordham University, where he graduated in 1987. He holds a Bachelor of Arts in Economics from George Washington University.
More Economy in Brief


