 Global| Feb 27 2017
U.S. Pending Home Sales Dip
Summary
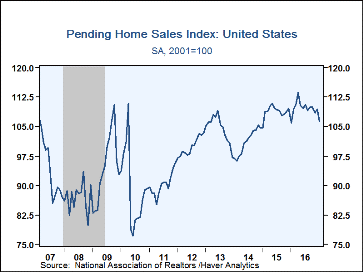
The National Association of Realtors (NAR) reported that pending home sales declined by 2.8% in January to an index level of 106.4. The index, which is reported on a 2001 = 100 basis, had hovered in a range near 109 for the past year [...]
The National Association of Realtors (NAR) reported that pending home sales declined by 2.8% in January to an index level of 106.4. The index, which is reported on a 2001 = 100 basis, had hovered in a range near 109 for the past year before dipping in January to its lowest level in a year.
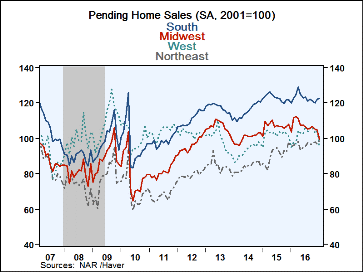
The NAR indicated that overall sales were hampered by insufficient supplies. In addition, the pending sales figures were mixed across regions, suggesting the series also may have been affected by weather. For example, the index in the West declined by 9.8% to 94.6, the lowest reading since June 2014, possibly reflecting the heavy rains in California. Meanwhile, pending sales in the Northeast hit a new cycle high of 98.7, amid unseasonably mild winter weather.
The pending home sales index measures home sales when the sales contract is signed, analogous to the new home sales report. In contrast, existing home sales are recorded when the sale is closed. In developing the pending home sales index, the NAR found that the level of monthly sales contract activity parallels the level of closed existing home sales in the following two months. The series dates back to 2001, and the data are available in Haver's PREALTOR database.
| Pending Home Sales (SA) | Jan | Nov | Oct | Jan Y/Y | 2016 | 2015 | 2014 |
|---|---|---|---|---|---|---|---|
| Total | 106.4 | 109.5 | 108.6 | 0.4 | 109.8 | 108.8 | 101.2 |
| Northeast | 98.7 | 96.5 | 97.8 | 3.6 | 96.3 | 90.7 | 83.9 |
| Midwest | 99.5 | 104.7 | 105.0 | -3.8 | 107.3 | 107.1 | 100.3 |
| South | 122.5 | 122.0 | 120.1 | 2.0 | 122.8 | 123.0 | 115.5 |
| West | 94.6 | 104.9 | 102.8 | -0.4 | 102.5 | 102.4 | 93.1 |
Peter D'Antonio
AuthorMore in Author Profile »Peter started working for Haver Analytics in 2016. He worked for nearly 30 years as an Economist on Wall Street, most recently as the Head of US Economic Forecasting at Citigroup, where he advised the trading and sales businesses in the Capital Markets. He built an extensive Excel system, which he used to forecast all major high-frequency statistics and a longer-term macroeconomic outlook. Peter also advised key clients, including hedge funds, pension funds, asset managers, Fortune 500 corporations, governments, and central banks, on US economic developments and markets. He wrote over 1,000 articles for Citigroup publications. In recent years, Peter shifted his career focus to teaching. He teaches Economics and Business at the Molloy College School of Business in Rockville Centre, NY. He developed Molloy’s Economics Major and Minor and created many of the courses. Peter has written numerous peer-reviewed journal articles that focus on the accuracy and interpretation of economic data. He has also taught at the NYU Stern School of Business. Peter was awarded the New York Forecasters Club Forecast Prize for most accurate economic forecast in 2007, 2018, and 2020. Peter D’Antonio earned his BA in Economics from Princeton University and his MA and PhD from the University of Pennsylvania, where he specialized in Macroeconomics and Finance.
More Economy in Brief
 Global| Feb 05 2026
Charts of the Week: Balanced Policy, Resilient Data and AI Narratives
by:Andrew Cates


