 Global| Dec 22 2005
U.S. Personal Income rose As Expected
by:Tom Moeller
|in:Economy in Brief
Summary
Personal income rose an expected 0.3% last month following an upwardly revised 0.5% increase in October. Growth in wage & salary income eased to 0.2% (4.2% y/y) from the unrevised 0.6% pop in October as factory sector wages fell 0.1% [...]
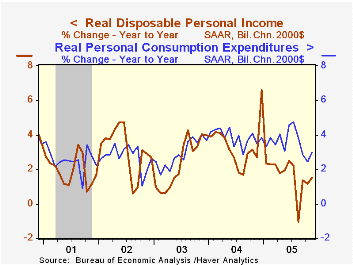
Personal income rose an expected 0.3% last month following an upwardly revised 0.5% increase in October.
Growth in wage & salary income eased to 0.2% (4.2% y/y) from the unrevised 0.6% pop in October as factory sector wages fell 0.1% (+3.3% y/y). Service sector wages rose 0.2% (4.2% y/y) following 0.5% increases in October and September while government wages increased 0.2% (3.3% y/y).
Disposable personal income rose 0.3% (4.3% y/y) following an upwardly revised 0.4% October gain. Adjusted for the 0.4% decline in prices, take home pay jumped 0.7% (1.5% y/y).
The PCE chain price index dropped 0.4% as gasoline prices fell. Less food & energy, prices rose the same 0.1% as in October. Durables prices fell 0.2% (-0.9% y/y) as new auto prices were flat. Appliance prices fell 0.7% (+3.7% y/y) and audio, video & computer prices dropped 1.2% (-9.9% y/y). Clothing & shoes prices rose 0.2% (-1.5% y/y) while services price rose 0.3% (3.2% y/y) following two months of 0.4% increase.
The 0.3% rise in personal consumption expenditures was a bit light of expectations. Nondurables outlays fell 1.0% (8.0% y/y) though less gasoline & oil, spending on nondurables jumped 1.1% (6.9% y/y) led by a 1.5% (5.8% y/y) jump in spending on clothing & shoes. Spending on motor vehicles & parts rose 5.4% m/m and that helped lift durables spending overall 2.7% (-0.8% y/y), helped by a 1.3% (5.9% y/y) increase in spending on furniture. Services spending increased 0.5% (6.0% y/y) for the second month and the gain was led by a 0.6% (17.5% y/y) rise in spending on electricity & gas services.
Great Expectations and the End of the Depression from the Federal Reserve Bank of New York is available here.
| Disposition of Personal Income | Nov | Oct | Y/Y | 2004 | 2003 | 2002 |
|---|---|---|---|---|---|---|
| Personal Income | 0.3% | 0.5% | 5.3% | 5.9% | 3.2% | 1.8% |
| Personal Consumption | 0.3% | 0.2% | 5.8% | 6.5% | 4.9% | 4.2% |
| Savings Rate | -0.2% | -0.3% | 1.3% (Nov '04) | 1.7% | 2.1% | 2.4% |
| PCE Chain Price Index | -0.4% | 0.1% | 2.7% | 2.6% | 1.9% | 1.4% |
| Less food & energy | 0.1% | 0.1% | 1.8% | 2.0% | 1.3% | 1.8% |
by Tom Moeller December 22, 2005
The Composite Index of Leading Economic Indicators from the Conference Board increased 0.5% following an upwardly revised 1.0% gain in October. It was the third increase in the last five months and beat Consensus expectations for a 0.4% rise.
The breadth of one month gain amongst the 10 components of the leading index remained firm at 70% as higher stock prices, a higher money supply, higher consumer confidence and fewer claims for unemployment insurance offset negative influences from lower capital goods orders and easier vendor performance.
The method of calculating the contribution to the index from the interest rate yield spread has been revised. A negative contribution will now occur only when the spread inverts rather than when declining as in the past. More details can be found here.
The leading index is based on eight previously reported economic data series. Two series, orders for consumer goods and orders for capital goods, are estimated.
The coincident indicators rose 0.2% following an upwardly revised 0.2% October gain. During the last ten years there has been a 64% correlation between the change in the coincident indicators and real GDP.
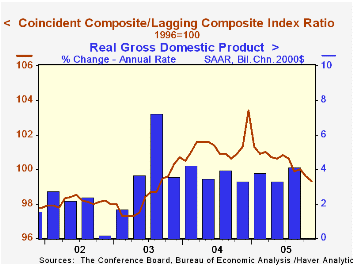
The lagging indicators rose 0.6% for the second month of strong gain led by higher C&I loans, a higher services CPI growth rate, a longer unemployment duration and higher interest rates. The ratio of coincident to lagging indicators, a measure of actual economic performance versus excess, fell for the eighth month this year to its lowest level since August 2003.
Visit the Conference Board's site for coverage of leading indicator series from around the world.
| Business Cycle Indicators | Nov | Oct | 6 Month Chg., AR | 2004 | 2003 | 2002 |
|---|---|---|---|---|---|---|
| Leading | 0.5% | 1.0% | 2.4% | 7.7% | 5.1% | 5.0% |
| Coincident | 0.2% | 0.2% | 1.2% | 2.7% | 0.4% | -0.6% |
| Lagging | 0.6% | 0.7% | 3.4% | -0.1% | -0.1% | -0.7% |
by Tom Moeller December 22, 2005

Initial claims for unemployment insurance fell 13,000 to 318,000 last week following an upwardly revised 3,000 increase the prior week. Consensus expectations had been for 325,000 claims.
The latest figure covers the survey period for December nonfarm payrolls and claims were up 13,000 (4.3%) from the November period. During the last ten year there has been a (negative) 75% correlation between the level of initial jobless insurance claims and the m/m change in payroll employment.
The four-week moving average of initial claims fell to 324,500 (-3.5% y/y).
Continuing unemployment insurance claims rose 41,000 following a lessened 12,000 gain the prior week.
The insured rate of unemployment ticked up to 2.1% following two weeks at 2.0%.
| Unemployment Insurance (000s) | 12/17/05 | 12/10/05 | Y/Y | 2004 | 2003 | 2002 |
|---|---|---|---|---|---|---|
| Initial Claims | 318 | 331 | -3.3% | 343 | 402 | 404 |
| Continuing Claims | -- | 2,638 | -3.0% | 2,926 | 3,531 | 3,570 |
by Tom Moeller December 22, 2005
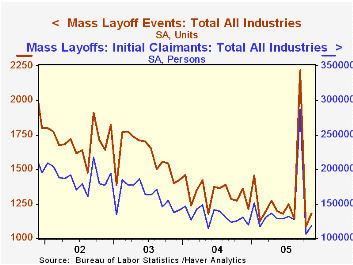
Mass layoffs rose 8.7% from October. Year to year, the number of mass layoffs fell by 13.1%.
During the last ten years there has been a (negative) 87% correlation between the three month average level of layoff announcements and the y/y change in payroll employment.
The number of persons affected by mass layoffs in November rose 11.2% m/m though the number remained below last year. By industry, the number of factory sector layoff announcements rose in November but the number of affected persons fell. In finance & insurance, the number of layoff announcements fell sharply and the number of affected persons dropped 21.1% (-9.4% y/y). In construction, the number of layoff announcements surged and generated a three fold m/m increase in the number of initial claims for unemployment insurance.
The Mass Layoff Statistics (MLS) program collects reports on mass layoff actions that result in workers being separated from their jobs. Monthly mass layoff numbers are from establishments which have at least 50 initial claims for unemployment insurance (UI) filed against them during a 5-week period.
How Predictable is Fed Policy? from St. Louis Federal Reserve Bank President William Poole can be found here.
| Mass Layoffs | Nov | Oct | Y/Y | 2004 | 2003 | 2002 |
|---|---|---|---|---|---|---|
| All US Industries (# Events, SA) | 1,183 | 1,088 | -13.1% | 15,900 | 19,155 | 20,472 |
| Total (# Persons, SA) | 118,098 | 106,238 | -9.3% | 1,588,483 | 1,936,463 | 2.256,014 |
by Carol Stone December 22, 2005
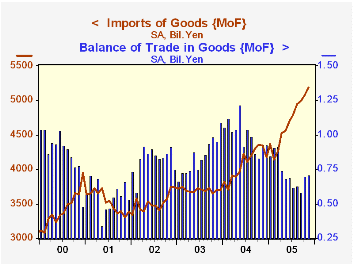
 Two months ago, when we last wrote about Japan's trade, we expressed some concern over import growth and the sensitivity to oil prices which it indicated for the health of the Japanese economy generally. This time, we've looked at these import data from a longer perspective, and we find some very interesting facts. In 1980, when petroleum prices were at then historic peaks just under $40/barrel, the value of petroleum imports into Japan was ¥1 trillion monthly. The quantity of petroleum imports averaged 21.2 million kiloliters monthly, making the unit value of petroleum imports ¥47,200 per kiloliter in 1980. Now, the dollar price of oil is far higher, averaging more than $56/barrel for the first 11 months of this year. But the unit value of oil imports into Japan has been only ¥34,800! The peak month was October, with ¥42,700 per kiloliter, still less than the 1980 average. Thus, the stronger yen and weaker dollar have made a tremendous difference for Japan in the burden of this surge in petroleum prices. Granted, the Japanese economy in general is not nearly so robust as it was in 1980 and the recent unit values are much higher than the ¥10,600 of ten years ago. But the impact is clearly more muted. Further, Japan, as elsewhere in the world, has become less dependent on petroleum usage. In fact, based on fixed-weight GDP in 1995 prices, a kiloliter of imported petroleum in 2004 supported ¥6.9 million of GDP (in Q2), 88% more than the 1980 average of ¥3.7 million.
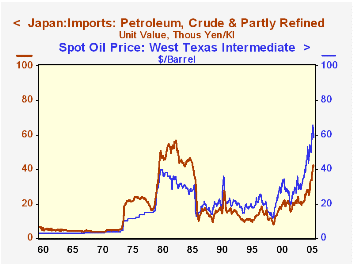
A technical note on these comments. In the third graph, we compare the unit value of Japanese petroleum imports to the price of West Texas Intermediate crude oil. The unit value series is not contained in Haver's JAPAN database, nor reported as such, to our knowledge.The Ministry of Finance reports the yen value of these imports, "petroleum, crude and partly refined", and also the quantity in millions of kiloliters. So, using DLXVG3, we can divide these two series to obtain the unit value. If we used the result as shown, the title of the graph would be the ratio of the codes for the two data series. But we can change that to give it a nicer label: using the drop-down menu under "Graph", we can click on "Titles" and then "Main Titles" to change the wording and the units as we desire. Then, if we want, we can save the modified graph in a "Folder" to be used later. During the New York City transit strike, I have prepared all of these graphs at home and emailed them and their specifications to Haver's office, so that they can be uploaded to this website.
| Japan: Bil.¥ SA except as noted |
Nov 2005 | Oct 2005 | Sept 2005 | Nov 2004 | Monthly Averages|||
|---|---|---|---|---|---|---|---|
| 2004 | 2003 | 2002 | |||||
| Trade Balance | 708.1 | 698.6 | 584.9 | 927.8 | 996.2 | 844.0 | 822.7 |
| Exports | 5894.6 | 5772.9 | 5576.4 | 5272.0 | 5078.6 | 4544.7 | 4339.5 |
| Yr/Yr % Chg (NSA) | 14.7 | 8.0 | 8.8 | 13.4 | 12.1 | 4.7 | 6.4 |
| Imports | 5186.5 | 5074.4 | 4991.5 | 4344.2 | 4082.5 | 3700.7 | 3516.8 |
| Yr/Yr % Chg (NSA) | 16.6 | 17.9 | 17.5 | 28.1 | 10.9 | 5.1 | -0.4 |
Tom Moeller
AuthorMore in Author Profile »Prior to joining Haver Analytics in 2000, Mr. Moeller worked as the Economist at Chancellor Capital Management from 1985 to 1999. There, he developed comprehensive economic forecasts and interpreted economic data for equity and fixed income portfolio managers. Also at Chancellor, Mr. Moeller worked as an equity analyst and was responsible for researching and rating companies in the economically sensitive automobile and housing industries for investment in Chancellor’s equity portfolio. Prior to joining Chancellor, Mr. Moeller was an Economist at Citibank from 1979 to 1984. He also analyzed pricing behavior in the metals industry for the Council on Wage and Price Stability in Washington, D.C. In 1999, Mr. Moeller received the award for most accurate forecast from the Forecasters' Club of New York. From 1990 to 1992 he was President of the New York Association for Business Economists. Mr. Moeller earned an M.B.A. in Finance from Fordham University, where he graduated in 1987. He holds a Bachelor of Arts in Economics from George Washington University.
More Economy in Brief
 Global| Feb 05 2026
Charts of the Week: Balanced Policy, Resilient Data and AI Narratives
by:Andrew Cates


