 Global| Nov 24 2010
U.S. Personal Income & Spending Firm While Savings Improves
Summary
Personal income may be finally on the mend. Overall income recovered 0.5% last month after a September dip and a 0.5% August gain, both of which were slightly higher than reported last month. A 0.4% gain last month had been expected. [...]
 Personal income may be finally on the mend. Overall income recovered
0.5% last month after a September dip and a 0.5% August gain, both of which were
slightly higher than reported last month. A 0.4% gain last month had been
expected. The catalysts for the October income gain was an improved 0.6%
increase in wages & salaries (3.4% y/y), a 0.9% rise (5.7% y/y) in
proprietors income and a 1.0% jump (-1.0% y/y) in interest income. These gains
offset a 0.6% decline in dividend income though it remained up a firm 6.1% from
last year. Also to the downside was a 4.1% drop (-5.9% y/y) in unemployment
insurance benefits (-18.8% y/y). The latest drop is part of the downdraft
following the extension of jobless insurance payouts during August. These pieces
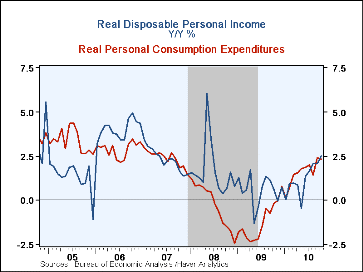
added up to a 0.4% increase in disposable income which, when adjusted for
prices, rose 0.3%. The y/y gain of 2.5% in real disposable income was the
strongest since 2008 when a tax cut stimulated a jump.
Personal consumption expenditures rose 0.4% last month after an upwardly revised 0.3% September gain. A 0.5% October increase had been expected. Spending on goods jumped 1.1% (5.7% y/y) due to a 3.6% surge (7.5% y/y) in spending on gasoline thanks to higher prices. Spending on motor vehicles also jumped 4.5% (14.3% y/y). Elsewhere, spending on goods generally firmed as well. Spending on services inched up 0.1% (2.6% y/y) for the second consecutive month.
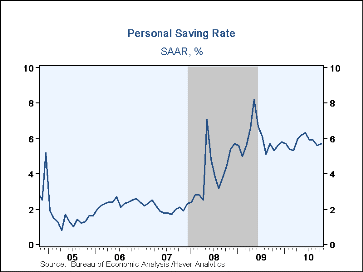
The personal savings rate rose to 5.7% from an upwardly revised 5.6% in September. The savings rate remained down from the 5.9% level for all of last year though it remained up from the monthly low of 1.8% late in 2007.
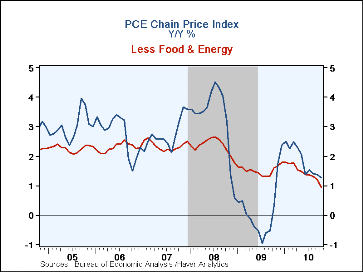
Price inflation remained modest. The PCE chain price index rose 0.2% after September's 0.1% uptick. The core PCE price deflator was unchanged for the second consecutive month. The declines resulted from lower monthly prices for autos (+2.8% y/y), furniture (-4.0% y/y) and apparel (-1.5% y/y). Twelve month growth of 1.3% in prices overall was the weakest since the early1960s.
The personal income & consumption figures are available in Haver's USECON and USNA databases.
>
| Personal Income & Outlays (%) | October | September | August | Y/Y | 2009 | 2008 | 2007 |
|---|---|---|---|---|---|---|---|
| Personal Income | 0.5 | -0.0 | 0.5 | 4.1 | -1.7 | 4.0 | 5.7 |
| Wages & Salaries | 0.6 | 0.1 | 0.3 | 3.4 | -4.3 | 2.1 | 5.8 |
| Disposable Personal Income | 0.4 | -0.1 | 0.5 | 3.8 | 0.7 | 5.1 | 5.1 |
| Personal Consumption Expenditures | 0.4 | 0.3 | 0.5 | 3.6 | -1.0 | 3.0 | 5.2 |
| Saving Rate | 5.7 | 5.6 | 5.9 | 5.3 (Oct.'09) | 5.9 | 4.1 | 2.1 |
| PCE Chain Price Index | 0.2 | 0.1 | 0.2 | 1.3 | 0.2 | 3.3 | 2.7 |
| Less Food & Energy | 0.0 | 0.0 | 0.1 | 0.9 | 1.5 | 2.3 | 2.4 |
By Tom Moeller
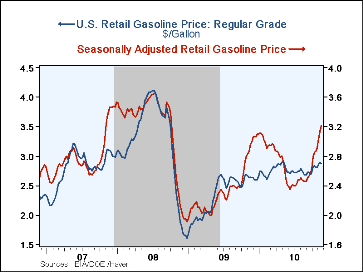
It may just be a temporary respite, but the pump price for regular gasoline eased last week to $2.88 per gallon, off a penny from the prior week. Nevertheless, prices have risen six cents this month after last month's ten cent gain. They remain up from the late-2009 level of $2.61 and from the December-2008 low of $1.61. Yesterday the spot market price for a gallon of regular gasoline of $2.23 was down from $2.28 averaged last week.
Normally, prices are weak now versus mid-year and Haver Analytics calculates seasonal factors which adjust for this behavior; the seasonals currently are boosting the price above that at the pump. Consequently, the seasonally adjusted gasoline pump price reached $3.21 per gallon last week. That's up sharply versus a low of $2.40 in early-July.
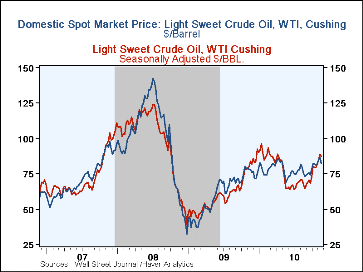
Crude oil prices follow the same seasonal pattern. Last week they eased to an average $82.20 for a barrel of light sweet crude oil (WTI) from the high of 86.86. Yesterday, the crude price remained down at $81.74 per barrel. Here again, however, normal seasonality suggests even weaker prices now. Therefore, adjusted crude oil price rose to $87.34 last week from $78.80 in October.
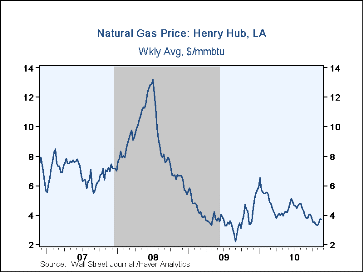
Lastly, natural gas prices improved last week to an average of $3.72 per mmbtu versus an average $3.49 in October. Yesterday, prices rose further to $3.932 but remained down from an early-January high of $6.50.
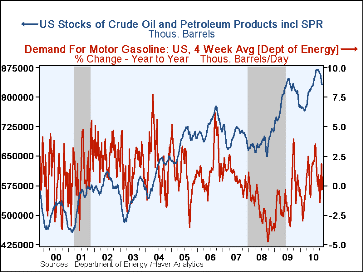
Demand for gasoline recently improved despite the weak economy and higher prices. It rose 1.8% in early-November versus last year after declines during October. The demand for residual fuel oil fell roughly one-quarter versus last year but distillate demand rose 13.9% y/y. Inventories of crude oil and petroleum products were rising until recently, but remain up 1.2% during the last twelve months.
The energy price data are reported by the U.S. Department of Energy and can be found in Haver's WEEKLY database. The daily figures are in DAILY and the gasoline demand figures are in OILWKLY.
| Weekly Prices | 11/22/10 | 11/15/10 | 11/08/10 | Y/Y% | 2009 | 2008 | 2007 |
|---|---|---|---|---|---|---|---|
| Retail Regular Gasoline ($ per Gallon, Regular) | 2.88 | 2.89 | 2.87 | 9.0 | 2.35 | 3.25 | 2.80 |
| Light Sweet Crude Oil, WTI($ per bbl.) | 82.20 | 86.86 | 84.79 | 4.9 | 61.39 | 100.16 | 72.25 |
| Natural Gas ($/mmbtu) | 3.72 | 3.77 | 3.42 | 11.0 | 3.95 | 8.88 | 6.97 |
By Carol Stone
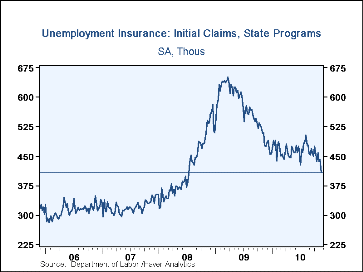
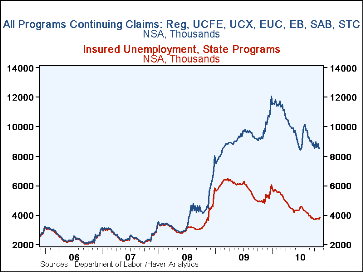
Continuing claims for state-administered programs fell 142,000 in the November 13 week to 4,182,000, their lowest level since November 22, 2008. The associated unemployment rate slipped to 3.3%. These claimants are, however, only about half of the total number of people currently receiving unemployment insurance. Regular extended benefits, with eligibility dependent on conditions in individual states, dropped to 863,470 on November 6, the latest figure available; renewed federal funding may see this number increase again in following weeks. The other extra program, Emergency Unemployment Compensation program, referred to as EUC 2008, also had a reduced number of beneficiaries, 3.801 million, down about 160,000 on the week. It will now accept claims through November 30 and will be continuing to pay out benefits until April 30, 2011.
A grand total of all claimants for unemployment insurance includes extended and emergency programs and specialized programs covering recently discharged veterans, federal employees and people in state-run "workshare" programs, among others. All together, on November 6, the total number of all program recipients was 8.532 million, off 7.3% y/y. Two other programs, disaster unemployment assistance (DUA) and trade readjustment allowance (TRA), are reported through a different Labor Department channel and have one more week's lag; an even more comprehensive total including those came to 8.861 million in the October 30 week, down 4.8% from a year ago. All of these individual program data are not seasonally adjusted.
Data on weekly unemployment insurance programs are contained in Haver's WEEKLY database and summarized monthly in USECON. Data for individual states, including the unemployment rates that determine individual state eligibility for the extended benefits programs and specific "tiers" of the emergency program, are in REGIONW, a database of weekly data for states and various regional divisions.
| Unemployment Insurance(000s) | 11/20/10 | 11/13/10 | 11/06/10 | Y/Y % | 2009 | 2008 | 2007 |
|---|---|---|---|---|---|---|---|
| Initial Claims | 407 | 444 | 437 | -14.7 | 572 | 419 | 321 |
| Continuing Claims | -- | 4,182 | 4,324 | -24.0 | 5,809 | 3,340 | 2,549 |
| Insured Unemployment Rate(%) | -- | 3.3 | 3.4 | 4.2 (11/09) |
4.4 | 2.5 | 1.9 |
| Total "All Programs" (NSA)* | -- | -- | -- | -7.3% | 9.170M | 3.931M | 2.634M |
*Excludes disaster unemployment assistance and trade readjustment allowance
By Tom Moeller
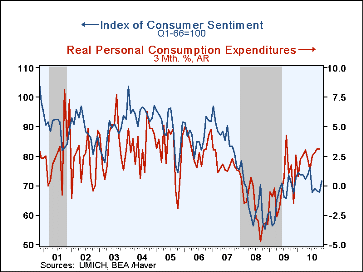
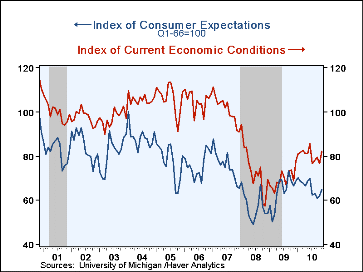
The sour mood adopted by the consumer this summer seems to be brightening. For November, the full-month consumer sentiment reading of 71.6 was a marked improvement from mid-month. The University of Michigan Index of Consumer Sentiment indicated that the latest figure was the highest since June and it handily beat Consensus expectations for 69.5. During the last ten years there has been a 60% correlation between the level of sentiment and the three-month growth in real consumer spending.
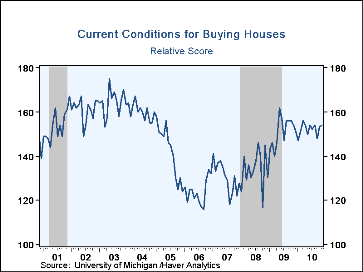
Like mid-month, the full-month current conditions figure provided most of the lift to the November total with a rise to 82.1 from 76.6. Perceived buying conditions for large household goods improved the most followed by the assessment of current personal finances. The consumer expectations index rose to 64.8, its highest since June. Feelings about business conditions during the next twelve months as well as the next five years rose from October but not enough to recover declines since the spring. The expected change in personal finances slipped m/m though less than at mid-month.
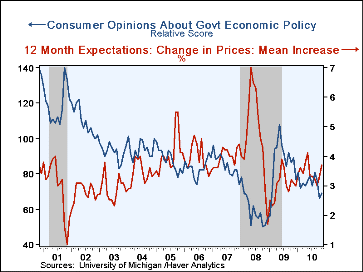
Expected price inflation during the next year jumped to 3.7%, its highest level since May. Respondents' view of government policy, which may eventually influence economic expectations, ticked up m/m to a reading of 69; still near its lowest since January 2009. Thirteen percent of respondents thought that a good job was being done by government while 44% thought a poor job was being done, near the most since January 2009.
The Reuters/University of Michigan survey data are not seasonally adjusted. The readings are based on telephone interviews with just over 300 households during early-to-mid November. The summary indexes are in Haver's USECON database with details in the proprietary UMSCA database.
| University of Michigan | Nov | Mid-Nov | Oct | Sep | Nov Y/Y % | 2009 | 2008 | 2007 |
|---|---|---|---|---|---|---|---|---|
| Consumer Sentiment | 71.6 | 69.3 | 67.7 | 68.2 | 6.2 | 66.3 | 63.8 | 85.6 |
| Current Economic Conditions | 82.1 | 79.7 | 76.6 | 79.6 | 19.3 | 69.6 | 73.7 | 101.2 |
| Expectations | 64.8 | 62.7 | 61.9 | 60.9 | -2.6 | 64.1 | 57.3 | 75.6 |
By Tom Moeller
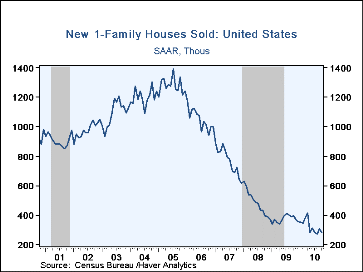 Weakness in the housing market was reinforced with this month's readings.
Yesterday, the figures on sales of existing single-family homes slipped. Today's
reading indicated that sales of new homes collapsed. The 8.1% decline to 282,000
nearly reversed all of September's gain from the series' low. Sales in the
Western region of the country were the weakest. They fell 23.9% from September
and were down nearly one-half from last year. Sales in the Midwest also fell
20.4% (-27.8% y/y) while sales in the Northeast were up merely 12.1% (-12.1%
y/y). Only sales in the South showed any strength with a 3.1% increase but they
still were off roughly one-quarter from last year.
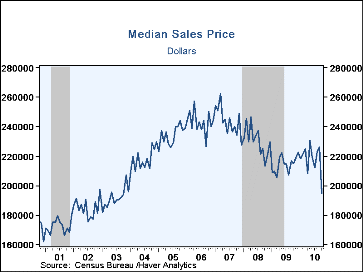
Emphasizing the message of weakness was the 13.9% m/m collapse in the median price of a new home to $194,900. The latest was the lowest since late-2003 (no typo). The lesser 8.0% decline in the average sales price of a new home indicates that sale prices of expensive homes held up (or they just stayed on the market). Nevertheless, the price of $248,200 also was the lowest since late-2003.
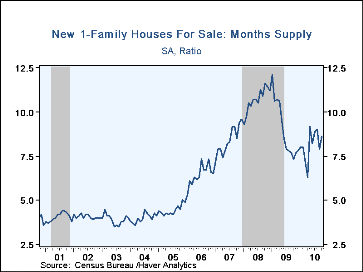
At the current sales rate, the months' supply of unsold homes rose back to 8.6; however, the latest remained well below the early-2009 high of 12.1 months. The inventory of unsold homes was down 16.5% from 12 months ago. It was off roughly two-thirds from the 2006 peak and stood at its lowest since 1968. The data in this report are available in Haver's USECON database.
| US New Homes | Oct | Sep | Aug | Y/Y % | 2009 | 2008 | 2007 |
|---|---|---|---|---|---|---|---|
| Total Sales (SAAR, 000s) | 283 | 308 | 275 | -28.5 | 372 | 481 | 769 |
| Northeast | 29 | 33 | 28 | -12.1 | 32 | 35 | 64 |
| Midwest | 39 | 49 | 32 | -27.8 | 54 | 69 | 118 |
| South | 164 | 159 | 150 | -23.0 | 201 | 264 | 409 |
| West | 51 | 67 | 65 | -46.9 | 87 | 113 | 178 |
| Median Price (NSA, $) | 194,900 | 226,300 | 223,200 | -9.4 | 214,500 | 230,408 | 243,742 |
by Carol Stone November 24, 2010
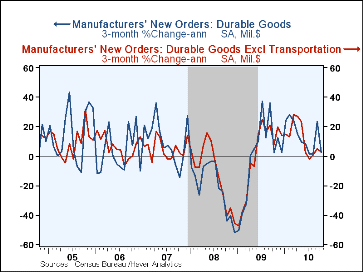
Tom Moeller began last month's discussion of durable goods order with the warning, "Be not misled by the headline figure", which was +3.3%, a hefty one-month gain. He continued, "The underlying trend of durable orders has weakened substantially." Indeed. Today, the Census Bureau reports that October new orders reversed the September surge, falling 3.3%, with declines across a number of industry categories. The Consensus forecast compiled by Action Economics called for a 0.3% increase. The whipsaw cannot be totally blamed on aircraft, often the culprit, since the October subtotal excluding transportation was also down, falling 2.7%. However, some of the concern in this figure can be alleviated by the upward revisions to September; total orders then are now seen up 5.0% and excluding transportation, they were lifted from a 0.8% decline to a 1.3% increase.
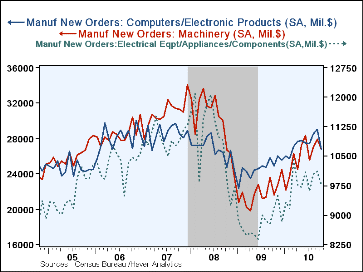
The October developments thus continue the hesitant pattern that emerged in May and June following several months of sustained and promising advances. Three major machinery categories, computers, electrical equipment and machinery itself all declined in October, with computers in particular dropping 7.7% and cutting short what had looked like a nice uptrend. In the transportation sector, motor vehicles extended a downward move that began in August. Aircraft by now seem to have no identifiable trend; those orders fell 4.4% in October, following a drop of 30.0% in August and a jump of 112.6% in September. If we smooth these a bit by looking at a 3-month moving average, we see that the nondefense aircraft segment came to $10.8 billion in October, compared with $5.3 billion a year ago. So there is some firmness overall.
Shipments of durable goods also remain sluggish. They fell 0.9% last month after a mild upward revision of September's 0.4% decrease to just above zero. This put the latest three months down 2.1% (8.3% annualized), the first negative reading on this basis since June of 2009.
Inventory accumulation continued to slow. Durable goods inventories rose 0.4% (6.8% y/y) but that contrasted with 1.2% monthly increases this spring. The three-month growth eased to 1.8% (7.4% annualized) from 1.9% (7.9% annual rate) in September and a high of 3.3% (13.9% A.R.) in June. Finally, backlogs of durable goods orders rose 0.7% during September, yielding a year-on-year gain of 1.8%, only the second year-to-year increase since the end of 2008.
The durable goods figures are available in Haver's USECON database.
| NAICS Classification (%) | October | September | August | Y/Y | 2009 | 2008 | 2007 |
|---|---|---|---|---|---|---|---|
| Durable Goods Orders | -3.3 | 5.0 | -0.8 | 10.5 | -20.7 | -9.0 | 9.7 |
| Excluding Transportation | -2.7 | 1.3 | 2.1 | 10.0 | -18.4 | -2.5 | 4.5 |
| Nondefense Capital Goods | -4.5 | 11.7 | 1.3 | 27.1 | -26.8 | -12.6 | 17.5 |
| Excluding Aircraft | -4.5 | 1.9 | 5.1 | 13.9 | -19.8 | -4.2 | 5.3 |
Carol Stone, CBE
AuthorMore in Author Profile »Carol Stone, CBE came to Haver Analytics in 2003 following more than 35 years as a financial market economist at major Wall Street financial institutions, most especially Merrill Lynch and Nomura Securities. She had broad experience in analysis and forecasting of flow-of-funds accounts, the federal budget and Federal Reserve operations. At Nomura Securities, among other duties, she developed various indicator forecasting tools and edited a daily global publication produced in London and New York for readers in Tokyo. At Haver Analytics, Carol was a member of the Research Department, aiding database managers with research and documentation efforts, as well as posting commentary on select economic reports. In addition, she conducted Ways-of-the-World, a blog on economic issues for an Episcopal-Church-affiliated website, The Geranium Farm. During her career, Carol served as an officer of the Money Marketeers and the Downtown Economists Club. She had a PhD from NYU's Stern School of Business. She lived in Brooklyn, New York, and had a weekend home on Long Island.
More Economy in Brief
 Global| Feb 05 2026
Charts of the Week: Balanced Policy, Resilient Data and AI Narratives
by:Andrew Cates


