 Global| Apr 30 2020
U.S. Personal Spending & Income Collapse in March
by:Tom Moeller
|in:Economy in Brief
Summary
• Spending cutbacks are widespread due to the coronavirus. • Personal income declines with the fall in employment. • Pricing power weakens. Personal consumption expenditures declined a record 7.5% (-3.8% y/y) during March as hiring [...]
• Spending cutbacks are widespread due to the coronavirus.
• Personal income declines with the fall in employment.
• Pricing power weakens.
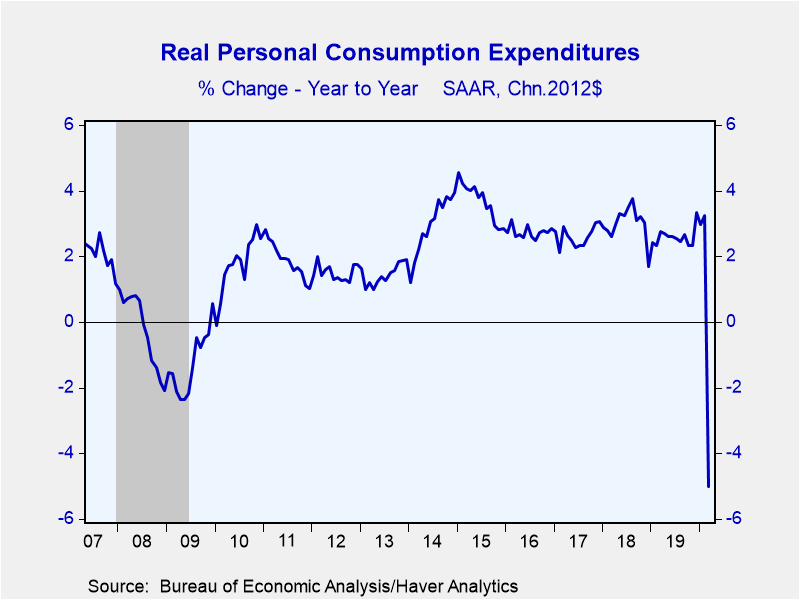
Personal consumption expenditures declined a record 7.5% (-3.8% y/y) during March as hiring collapsed, businesses closed and government stay-at-home guidelines were put in place. A 6.5% decline had been expected in the Action Economics Forecast Survey. In constant dollars, total spending fell 7.3% (-5.0% y/y). Real durable goods spending declined 14.8% (-11.2% y/y) during March. Spending on motor vehicles fell by roughly one-quarter both m/m and y/y, the fourth consecutive monthly decline. Home furniture & appliance buying weakened 8.3% (-4.4% y/y) and recreational goods & vehicles outlays fell 6.3% (+3.0% y/y). Real nondurable goods buying surged a record 4.3% last month (6.6% y/y). The jump came as food & beverage sales strengthened 19.1% (20.9% y/y) with the stay-at-home requirement. Apparel spending dropped 28.2% (-27.9% y/y) and has been falling since early last year. Real gasoline outlays weakened 5.3% (-4.5% y/y). Real spending on services plunged a record 9.5% (-7.5% y/y). The decline was led by a 29.7% drop (-27.7% y/y) in sales of restaurants & hotels. Transportation services outlays weakened 23.7% (-22.2% y/y) and outlays on health care fell 16.2% (-14.3% y/y). These declines were tempered by an unchanged level (+1.3% y/y) of outlays on housing & utilities.
Personal income declined 2.0% (+1.4% y/y) in March. A 1.8% decline had been expected. Wages & salaries fell 3.1% (-0.8% y/y) due to the drastic cut in employment with the outbreak of the coronavirus. Proprietors income plunged 8.2% (+0.4%% y/y) following two months of strong increase. Rental incomes rose a steady 0.4% (4.0% y/y) while receipts on assets eased 0.1% (+1.8% y/y), due to a 0.4% decline (0.0% y/y) in personal interest income. Dividend income rose 0.3% (4.2% y/y). Transfer receipts improved 1.6% (6.3% y/y), the largest gain since January of 2019.
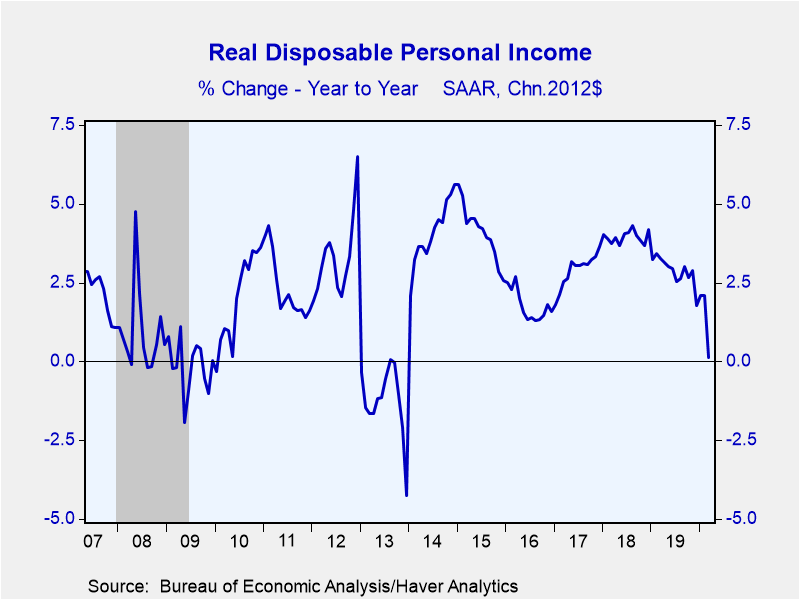
Disposable personal weakened 2.0% (+1.4% y/y) last month, the largest decline since January 2013. Adjusted for price inflation, take-home pay fell 1.7% (+0.1% y/y) after two months of 0.4% improvement.
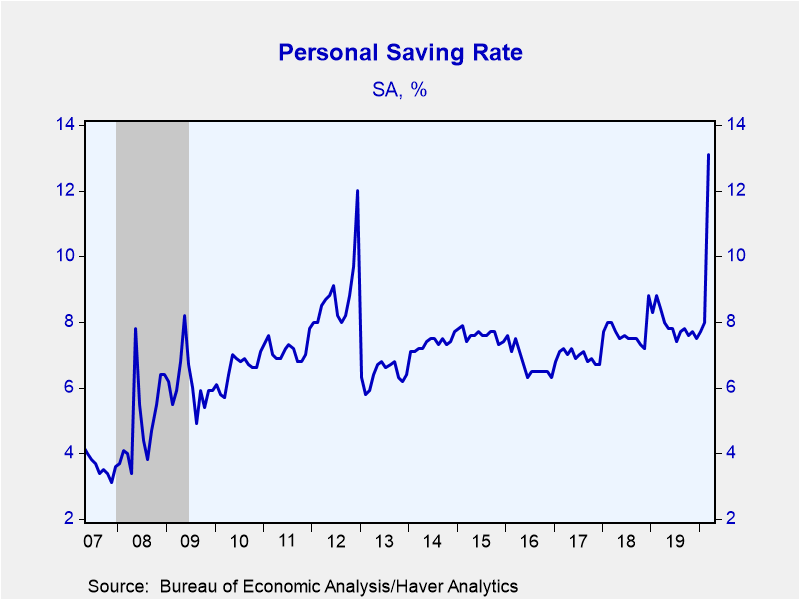
Last month's strength in income relative to spending caused the personal savings rate to surge to 13.1%, the highest level since October 1975. The level of personal saving rose by nearly two-thirds y/y.
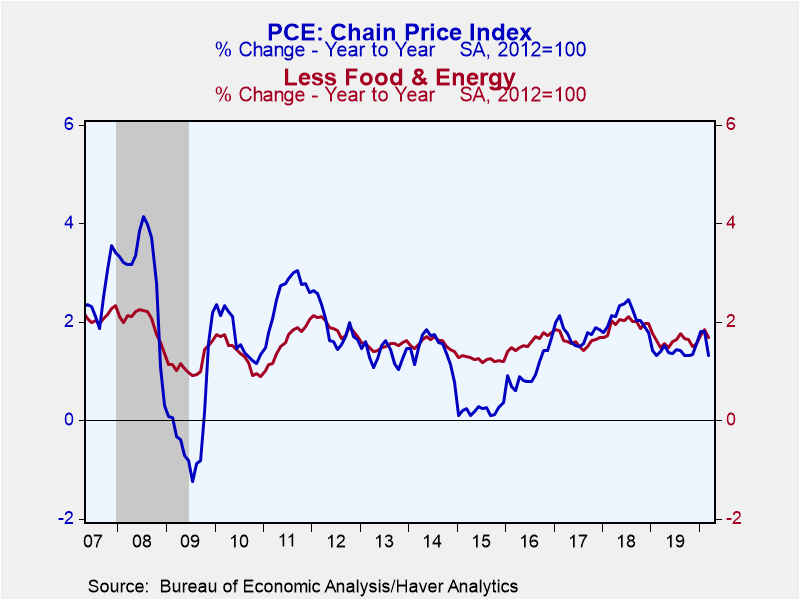
The PCE chain price index decreased 0.3% in March (+1.3% y/y). The price index excluding food & energy slipped 0.1% (+1.7% y/y). Motor vehicle prices edged 0.4% lower (-0.9% y/y) and home furnishings & appliance prices also fell 0.4% both m/m and y/y. Apparel costs dropped 2.2% (-1.6% y/y). Gasoline & oil prices fell 10.4% (-10.7% y/y). Services costs held steady (2.4% y/y). Housing & utilities prices rose 0.2% (2.9% y/y) and health care prices edged 0.1% higher (2.1% y/y). Energy prices were off 6.1% (6.7% y/y), the third straight monthly decline. Food prices rose 0.6% (1.1% y/y), the strongest increase since August 2011.
The personal income and consumption figures are available in Haver's USECON database with detail in the USNA database. The Action Economics figures are in the AS1REP NA database
Tom Moeller
AuthorMore in Author Profile »Prior to joining Haver Analytics in 2000, Mr. Moeller worked as the Economist at Chancellor Capital Management from 1985 to 1999. There, he developed comprehensive economic forecasts and interpreted economic data for equity and fixed income portfolio managers. Also at Chancellor, Mr. Moeller worked as an equity analyst and was responsible for researching and rating companies in the economically sensitive automobile and housing industries for investment in Chancellor’s equity portfolio. Prior to joining Chancellor, Mr. Moeller was an Economist at Citibank from 1979 to 1984. He also analyzed pricing behavior in the metals industry for the Council on Wage and Price Stability in Washington, D.C. In 1999, Mr. Moeller received the award for most accurate forecast from the Forecasters' Club of New York. From 1990 to 1992 he was President of the New York Association for Business Economists. Mr. Moeller earned an M.B.A. in Finance from Fordham University, where he graduated in 1987. He holds a Bachelor of Arts in Economics from George Washington University.
More Economy in Brief
 Global| Feb 05 2026
Charts of the Week: Balanced Policy, Resilient Data and AI Narratives
by:Andrew Cates


