 Global| Sep 15 2016
U.S. PPI Pressures Stay at Bay
Summary
In August, the U.S. PPI for final demand was dead flat with the core (excluding food and energy) up in the month by a thin 0.1%. The PPI is coming off a volatile streak; it rose by 0.5% in June and then fell by 0.4% in July. Headline [...]
 In August, the U.S. PPI for final demand was dead flat with the core (excluding food and energy) up in the month by a thin 0.1%. The PPI is coming off a volatile streak; it rose by 0.5% in June and then fell by 0.4% in July.
Headline PPI Final Demand
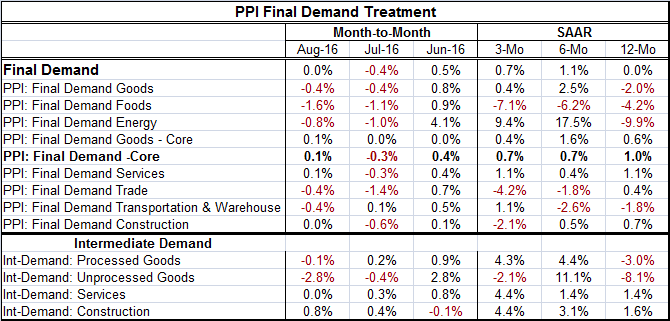
The PPI headline and core are no longer accelerating in terms of their sequential rates of growth. The headline PPI is flat over 12 months, up at a 1.1% pace over six months, and up at a slower 0.7% annual rate over three months.
Core PPI Final Demand
The core PPI for final demand is up by 1% over 12 months and rising at a 0.7% annualized rate over periods of six months and three months. This is pretty much steady state expansion at a pace well below the Fed's target.
The Fed and Its Inflation Target
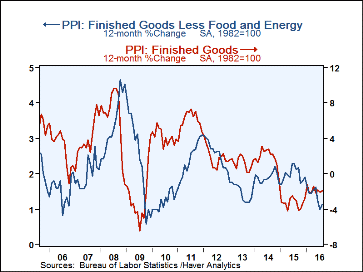
Of course, the Fed's inflation target is for the PCE. And recently Fed officials have been talking more about the core PCE than the headline because the core has been firmer than the headline. But in truth, inflation is simply below the Fed's preferred pace and at a more or less steady of expansion - as steady as it ever gets. And the PPI is also in that camp- the chart shows these trends.
Inflation Context
Today's PPI report was released in a landslide of other reports. These reports, ranging from retail sales to industrial output to the Empire State manufacturing index to the Philadelphia Fed manufacturing index, have in common the theme of weakness. Retail sales fell, IP fell, the NY manufacturing gauge remained negative, the Philly gauge rose in value but is still modest and its future index fell back and signaled slowing growth ahead. This is not exactly an environment in which there is likely to be inflation acceleration. But inflation and growth are separate events. And at various times in a business cycle they will couple or de-couple. For now the environment does not look very inflation friendly and the Fed is behind the eight ball in terms of getting inflation up to its policy objective. As much as we know that the Fed feels that the fed funds rate is too low and wants desperately to hike it, it received no rationale for doing that today and that includes the PPI report.
Some Details: Food and Energy
Final demand energy and food prices were weak in August: food price fell by 1.6% and energy prices fell by 0.8%. Food prices are falling and decelerating from 12 months, to six months to three months. Energy is still enjoying the tail end of a wild ride. In big picture terms, energy prices soared then crashed in late 2015 and have stabilized and started to rise in mid-to-late 2016. But within this broad cycle framework, there are mini-cycles and there is still an unresolved future for oil. Today, for example, oil prices rose although there was an extra-large oil inventory build that just took place. Energy prices are down for two months in a row, but up at a 9.4% annual rate over three months and up at a 17.5% annual rate over six months. Yet, energy prices are still net lower by 9.9% over 12 months. Since energy will affect other prices with a lag, this sort of choppy behavior is suggesting of a muffled energy price effect on other prices overall.
Services Prices
Services prices in the PPI rose by 0.1% in August; they have been at 1.1% or weaker over all three main horizons in the table. Prices for trade and for transportation & warehousing both fell in August. Trade prices are decelerating from 12 months to six months to three months. But in transportation and warehousing prices trends are more convoluted. Construction sector prices were flat in August and prices there also are decelerating from 12 months to six months to three months. Over three months, construction prices are falling at a 2.1% annual rate.
Final Demand Intermediate Prices
Intermediate prices show more pressures for processed goods with inflation just short of the 4.5% mark over three months and six months but with prices falling over 12 months. For unprocessed goods, there is a rollercoaster of price changes. Intermediate demand for services shows inflation pressures have stepped up from 1.4% over 12 months and six months to 4.4% over three months. The construction sector also shows intermediate prices building a head of steam and actually accelerating. Construction is the only category in the table with a clear price acceleration trend in gear.
The PPI Signal
On balance, the PPI is a significant report. It is not the Fed's main or favorite inflation report, but it tells us about industrial and upstream price pressures and that is useful information. Coupled with the U.S. import price report yesterday that was still weak, the emerging picture is still that of moderate inflation. Much of the moderation still is coming from the commodities area (food and energy), but there is only scant evidence of any demand pressure or industrial tightness pushing up prices anywhere. The services sector has been the most consistently strong sector in the economy and we do not see inflation pressured there.
PPI Fails to Support Fed Worries
In short, the PPI does not line up to back the Fed's concerns about building inflation pressures. The day's reports also make any concerns about overheating or certainty about firming growth figments of the imagination. These reports even unravel some of that strength that was in train for Q3. The economy simply is not pushing ahead and not dropping the hammer on inflation. Growth is not accelerating. Inflation is not building. And despite many statements to the contrary by Fed officials or statements that embody their assurances about the future, there should be no assurance about the future. If the past is prologue, the Fed remains as clueless as ever about economic performance and about the economy's next twist, turn, dip, dive or acceleration. There is enough price and activity weakness here to keep a responsible central bank sitting in its hands for some time. But the problem for the Fed has not so much been misuse of its hands as it has been its tendency to talk too much with too many cross currents and not enough clarity. That is not going to change.

Robert Brusca
AuthorMore in Author Profile »Robert A. Brusca is Chief Economist of Fact and Opinion Economics, a consulting firm he founded in Manhattan. He has been an economist on Wall Street for over 25 years. He has visited central banking and large institutional clients in over 30 countries in his career as an economist. Mr. Brusca was a Divisional Research Chief at the Federal Reserve Bank of NY (Chief of the International Financial markets Division), a Fed Watcher at Irving Trust and Chief Economist at Nikko Securities International. He is widely quoted and appears in various media. Mr. Brusca holds an MA and Ph.D. in economics from Michigan State University and a BA in Economics from the University of Michigan. His research pursues his strong interests in non aligned policy economics as well as international economics. FAO Economics’ research targets investors to assist them in making better investment decisions in stocks, bonds and in a variety of international assets. The company does not manage money and has no conflicts in giving economic advice.
More Economy in Brief
 Global| Feb 05 2026
Charts of the Week: Balanced Policy, Resilient Data and AI Narratives
by:Andrew Cates


