 Global| Jan 15 2021
U.S. PPI Rose 0.3% in December
by:Sandy Batten
|in:Economy in Brief
Summary
• Food prices edged down while energy prices surged. • Core goods prices posted largest monthly rise since January 2014. • Service prices fell due to outsized drop in prices of trade services. The Producer Price Index for final demand [...]
• Food prices edged down while energy prices surged.
• Core goods prices posted largest monthly rise since January 2014.
• Service prices fell due to outsized drop in prices of trade services.
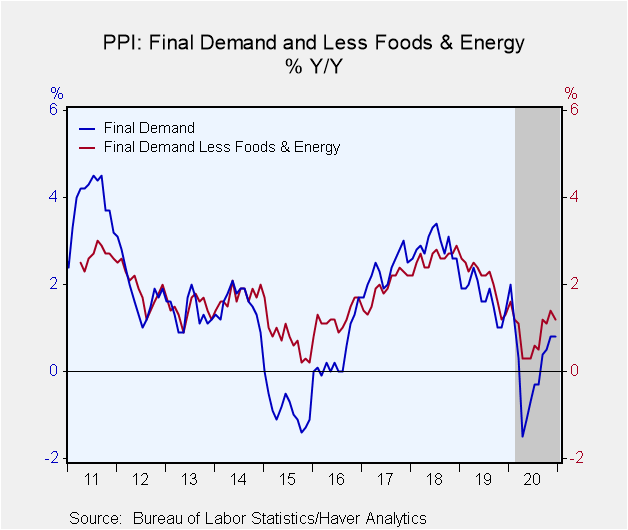
The Producer Price Index for final demand rose 0.3% (0.8% y/y) in December following a 0.1% m/m rise in November and a 0.3% m/m gain in October. The Action Economics Forecast Survey had expected a 0.4% m/m increase. Energy prices surged 5.5% m/m while prices of trade services slumped 0.8% m/m. Producer prices excluding food and energy edged 0.1% higher (1.2% y/y), the same change as in October. A 0.2% increase had been expected. Another measure of underlying prices, the PPI excluding food, energy and trade services, increase 0.4% m/m (1.1% y/y) in December, up from 0.1% m/m in November. For all of 2020, producer prices edged up 0.2% versus increases of 1.7% in 2019 and 2.9% in 2018. Producer prices excluding food, energy and trade services rose 0.7% in 2020 versus 2.0% in 2019 and 2.9% in 2018.
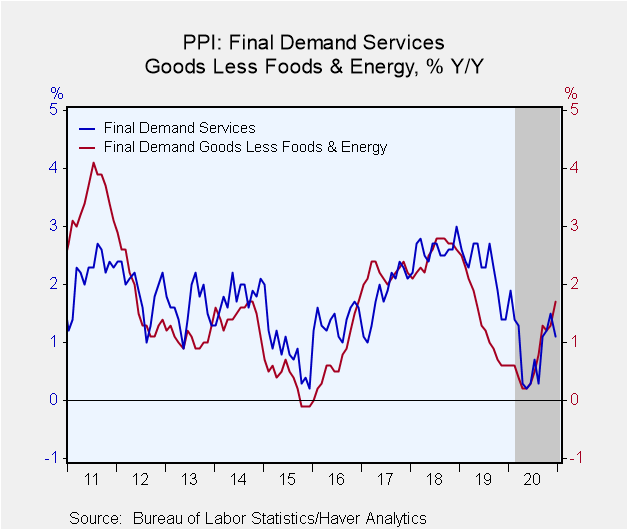
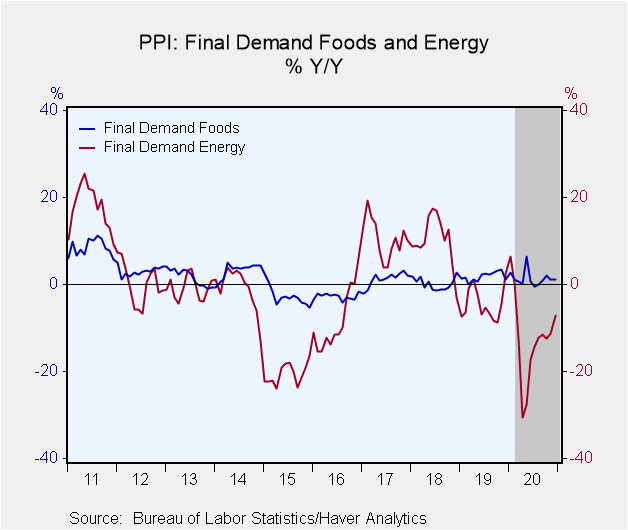
Final demand goods prices rose 1.1% m/m (0.2% y/y) in December, their largest monthly gain since May. Nearly half of the increase was attributable to a 16.1% m/m jump in gasoline prices. Food prices slipped 0.1% m/m (+1.2% y/y), their first monthly decline in four months. Energy prices jumped up 5.5% m/m (-7.1% y/y) in November, their largest monthly gain since June. In addition to the jump in gasoline prices, home heating oil prices skyrocketed 47.6% m/m and diesel fuel prices rose 12.6% m/m. Final demand prices less food and energy increased 0.5% m/m (1.7% y/y), their largest monthly increase since January 2014. Finished consumer goods prices rose 0.2% m/m in December as did prices of private capital equipment.
Services prices for final demand slipped 0.1% m/m (+1.1% y/y), their first monthly decline since a 0.4% m/m drop in April. Trade services prices slumped 0.8% m/m (+1.7% y/y) on top of a 0.3% m/m decline in November. This category, which accounts for nearly 1/3 of final demand services prices, measures changes in margins received by wholesalers and retailers, rather than actual prices, and hence is difficult to interpret. Services prices excluding trade margins, transportation and warehousing rose 0.2% m/m (1.5% y/y) in December.
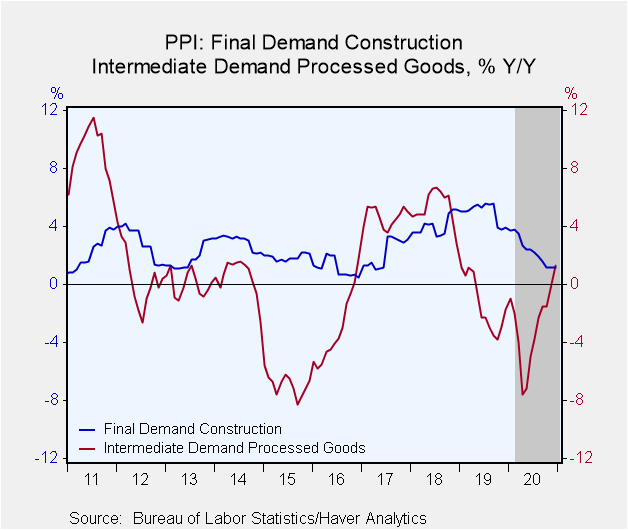
The cost of construction edged 0.1% higher (1.2% y/y) in December, the same monthly increase as in November.
Intermediate product prices for processed goods rose 1.5% m/m (1.3% y/y) in December, the largest monthly increase since February 2011, on top of a 1.4% m/m gain in November. Nearly 60% of the broad-based December increase was attributable to prices for processed materials less foods and energy, which climbed 1.2% m/m.
The PPI data can be found in Haver's USECON database. Further detail can be found in PPI and PPIR. The expectations figures are available in the AS1REPNA database.
| Producer Price Index (SA, %) | Dec | Nov | Oct | Dec Y/Y | 2020 | 2019 | 2018 |
|---|---|---|---|---|---|---|---|
| Final Demand | 0.3 | 0.1 | 0.3 | 0.8 | 0.2 | 1.7 | 2.9 |
| Excluding Food & Energy | 0.1 | 0.1 | 0.1 | 1.2 | 0.9 | 2.1 | 2.6 |
| Excluding Food, Energy & Trade Services | 0.4 | 0.1 | 0.2 | 1.1 | 0.7 | 2.0 | 2.9 |
| Goods | 1.1 | 0.4 | 0.5 | 0.2 | -1.4 | 0.4 | 3.4 |
| Foods | -0.1 | 0.5 | 2.4 | 1.2 | 1.4 | 1.8 | 0.2 |
| Energy | 5.5 | 1.2 | 0.8 | -7.1 | -12.8 | -4.4 | 10.1 |
| Goods Excluding Food & Energy | 0.5 | 0.2 | 0.0 | 1.7 | 0.8 | 1.4 | 2.5 |
| Services | -0.1 | 0.0 | 0.2 | 1.1 | 0.9 | 2.2 | 2.6 |
| Trade Services | -0.8 | -0.3 | 0.2 | 1.7 | 1.7 | 2.5 | 1.8 |
| Construction | 0.1 | 0.1 | 0.0 | 1.2 | 2.3 | 4.9 | 4.1 |
| Intermediate Demand - Processed Goods | 1.5 | 1.4 | 0.3 | 1.3 | -2.9 | -1.4 | 5.4 |
Sandy Batten
AuthorMore in Author Profile »Sandy Batten has more than 30 years of experience analyzing industrial economies and financial markets and a wide range of experience across the financial services sector, government, and academia. Before joining Haver Analytics, Sandy was a Vice President and Senior Economist at Citibank; Senior Credit Market Analyst at CDC Investment Management, Managing Director at Bear Stearns, and Executive Director at JPMorgan. In 2008, Sandy was named the most accurate US forecaster by the National Association for Business Economics. He is a member of the New York Forecasters Club, NABE, and the American Economic Association. Prior to his time in the financial services sector, Sandy was a Research Officer at the Federal Reserve Bank of St. Louis, Senior Staff Economist on the President’s Council of Economic Advisors, Deputy Assistant Secretary for Economic Policy at the US Treasury, and Economist at the International Monetary Fund. Sandy has taught economics at St. Louis University, Denison University, and Muskingun College. He has published numerous peer-reviewed articles in a wide range of academic publications. He has a B.A. in economics from the University of Richmond and a M.A. and Ph.D. in economics from The Ohio State University.
More Economy in Brief
 Global| Feb 05 2026
Charts of the Week: Balanced Policy, Resilient Data and AI Narratives
by:Andrew Cates


