 Global| Sep 11 2015
U.S. Producer Price Total Unchanged in August as Core Prices Continue To Rise
Summary
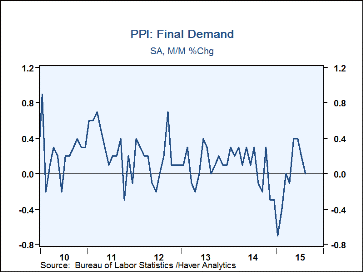
The overall Final Demand Producer Price Index was flat in August (-0.8% y/y) following a 0.2% increase in July. The Action Economics Forecast Survey looked for a 0.1% decrease. Prices excluding food & energy were also stronger than [...]
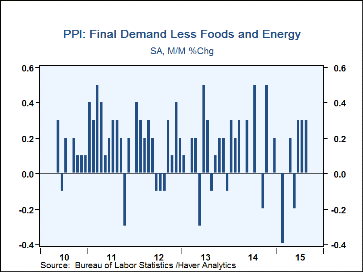
The overall Final Demand Producer Price Index was flat in August (-0.8% y/y) following a 0.2% increase in July. The Action Economics Forecast Survey looked for a 0.1% decrease. Prices excluding food & energy were also stronger than expectations, rising 0.3% (0.9% y/y) for a third straight month. A 0.1% uptick had been expected.
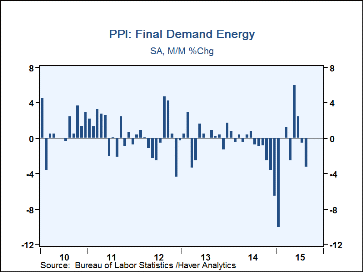
Final demand goods prices (35% of the total index) fell 0.6% (-4.1% y/y) in August after easing 0.1% in July. The latest decline was again paced by energy prices, which fell 3.3% (-19.6% y/y). Home heating oil costs also again led this drop, down by 11.0% (-41.0%). Gasoline was next with a 7.7% fall (-32.6% y/y), and diesel fuel was down 4.1% (-38.0% y/y). Residential electric power edged down 0.2% (+1.3% y/y). Residential natural gas was the only energy category with an increase, 1.5% (-10.5% y/y). Food prices turned back up, rising 0.3% in August (-2.2% y/y) after their brief 0.1% dip in July. Egg prices were the biggest mover, pushing back up by 32.3% after their 24.8% drop in July; these were thus up by 130.2% from August 2014. Fresh vegetables, fresh fruits and beef and veal were also up, while other meats and dairy prices were down.
Final demand goods prices excluding food & energy decreased 0.2% in August (+0.4% y/y), after being unchanged in July. Finished consumer goods were flat for a second month (+2.7% y/y). Consumer nondurables (ex food and energy) were also flat (+3.6% y/y), but consumer durables fell 0.2% (+1.4% y/y). Private capital equipment costs decreased 0.1% (1.3% y/y), goods for government purchase rose 0.2% (+0.2% y/y) and those for export fell 0.5% (-3.2% y/y).
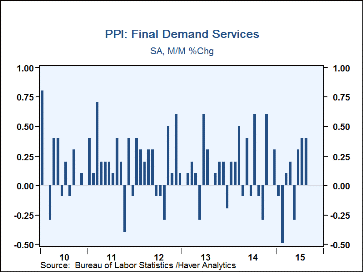
Final demand services costs (63% of the total index) increased 0.4% again in August as they had in July (+1.0% y/y). This was led by trade services, which rose 0.9% (+1.6% y/y); trade services represent the margins charged by retail and wholesale dealers and merchants. Prices for transportation of passengers turned back down by 1.6% in August (-5.1% y/y) after rising 0.9% in July. Prices for transportation and warehousing of goods fell 0.3% (-2.1% y/y) after being unchanged. Other services, including financial, health care and communications, among others, rose 0.2% in August (+1.2% y/y) after July's 0.4% rise.
Final demand construction prices (2.0% of the index) eased 0.1% (+1.8% y/y) in August after a sizable 0.5% rise in July. The earlier gain was generated mainly by health care building costs, which had increased 0.8%, and that category immediately declined by 0.8% then in August (+0.5% y/y).
Prices of processed goods for intermediate demand fell 0.6% in August (-7.0% y/y) following a 0.2% reduction in July.
The PPI data are contained in Haver's USECON database with further detail in PPI and PPIR. The expectations figures are available in the AS1REPNA database.
| Producer Price Index (SA, %) | Aug | Jul | Jun | Aug Y/Y | 2014 | 2013 | 2012 |
|---|---|---|---|---|---|---|---|
| Final Demand | 0.0 | 0.2 | 0.4 | -0.8 | 1.6 | 1.3 | 1.9 |
| Excluding Food & Energy | 0.3 | 0.3 | 0.3 | 0.9 | 1.7 | 1.5 | 1.9 |
| Goods | -0.6 | -0.1 | 0.7 | -4.1 | 1.3 | 0.8 | 1.7 |
| Foods | 0.3 | -0.1 | 0.6 | -2.2 | 3.2 | 1.7 | 3.0 |
| Energy | -3.3 | -0.6 | 2.4 | -19.6 | -1.0 | -0.8 | 0.2 |
| Goods Excluding Food & Energy | -0.2 | 0.0 | 0.4 | 0.4 | 1.5 | 1.1 | 1.8 |
| Services | 0.4 | 0.4 | 0.3 | 1.0 | 1.8 | 1.6 | 1.9 |
| Construction | -0.1 | 0.5 | 0.1 | 1.8 | 3.0 | 1.8 | 2.9 |
| Intermediate Demand - Processed Goods | -0.6 | -0.2 | 0.7 | -7.0 | 0.6 | 0.0 | 0.5 |
Carol Stone, CBE
AuthorMore in Author Profile »Carol Stone, CBE came to Haver Analytics in 2003 following more than 35 years as a financial market economist at major Wall Street financial institutions, most especially Merrill Lynch and Nomura Securities. She has broad experience in analysis and forecasting of flow-of-funds accounts, the federal budget and Federal Reserve operations. At Nomura Securites, among other duties, she developed various indicator forecasting tools and edited a daily global publication produced in London and New York for readers in Tokyo. At Haver Analytics, Carol is a member of the Research Department, aiding database managers with research and documentation efforts, as well as posting commentary on select economic reports. In addition, she conducts Ways-of-the-World, a blog on economic issues for an Episcopal-Church-affiliated website, The Geranium Farm. During her career, Carol served as an officer of the Money Marketeers and the Downtown Economists Club. She has a PhD from NYU's Stern School of Business. She lives in Brooklyn, New York, and has a weekend home on Long Island.


