 Global| Jun 15 2021
U.S. Producer Prices Rise Further in May
by:Sandy Batten
|in:Economy in Brief
Summary
• May jump led by 1.5% m/m surge in prices of final demand goods. • Y/Y increases in both headline and core indexes highest in series history. • Final demand food prices up 2.6% m/m; energy prices up 2.2% m/m. The Producer Price Index [...]
• May jump led by 1.5% m/m surge in prices of final demand goods.
• Y/Y increases in both headline and core indexes highest in series history.
• Final demand food prices up 2.6% m/m; energy prices up 2.2% m/m.
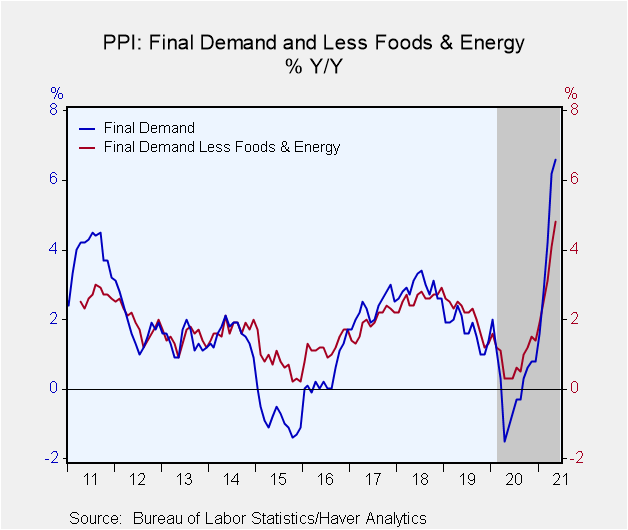
The Producer Price Index for final demand increased 0.8% m/m (6.6% y/y) in May following a 0.6% m/m gain in April. The annual increase is the largest in the series history dating back to November 2009. The index has risen at a 9.9% annual rate over the past three months. A 0.5% rise had been expected by the Action Economics Forecast Survey. Nearly 60% of the May increase in the index for final demand can be traced to a 1.5% m/m rise in prices for final demand goods. The index for final demand services moved up 0.6% m/m in May.
The PPI excluding food and energy prices gained 0.7% m/m (4.8% y/y) in May for a third consecutive month. A 0.5% rise had been expected. The PPI less prices of food, energy and trade services rose 0.7% m/m (5.3% y/y), the same monthly increase as in April.
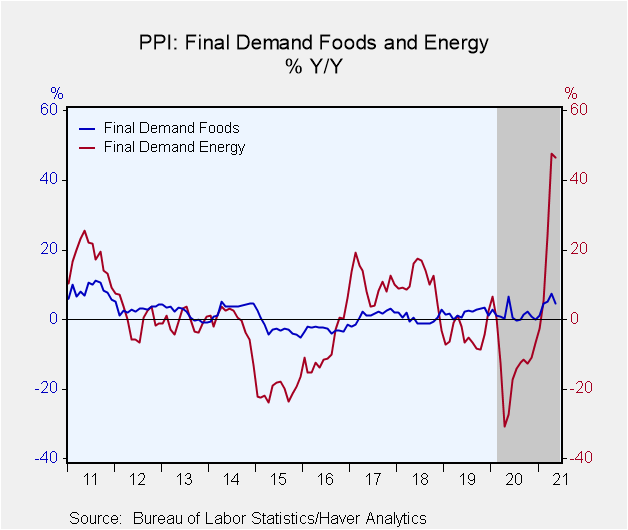
Prices for final demand goods advanced 1.5% m/m (11.1% y/y) in May after rising 0.6% in April. Over 40% of the broad-based increase in May can be traced to the index for final demand goods less foods and energy, which moved up 1.1% m/m. Prices for final demand foods rose 2.6% m/m in May, their largest monthly gain since May 2020. Prices for final demand energy rebounded 2.2% m/m after having fallen 2.4% m/m in April. Final demand energy prices have risen 47% in the past year and at a 52% annual rate over the past six months.
Within final demand goods, prices for nonferrous metals rose 6.9% m/m. The indexes for beef and veal; diesel fuel; gasoline; and motor vehicles also advanced. By contrast, prices for fresh fruits and melons declined 1.9% m/m. The indexes for primary basic organic chemicals and for asphalt also moved lower.
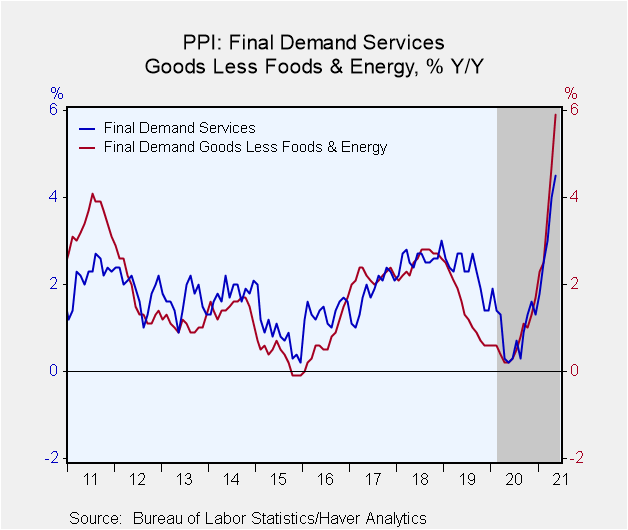
Final demand goods prices excluding food and energy increased 1.1% m/m (5.9% y/y) in May versus a 1.0% m/m gain in April. Core finished goods prices advanced 0.6% m/m (2.9% y/y), the same monthly gain as in April. Prices of private capital equipment rose 0.8% m/m (2.7% y/y) in May after a 0.6% m/m gain in April. Prices of core government purchases increased 0.8% m/m (4.8% y/y) in May, the same as in April.
Final demand services prices increased 0.6% m/m (4.5% y/y) in May, the same monthly gain as in April. Trade services prices rose 0.7% m/m (3.6% y/y), accounting for about 40% of the May increase. Prices for final demand services less trade, transportation, and warehousing rose 0.2% m/m while prices for final demand transportation and warehousing services jumped 1.9% m/m.
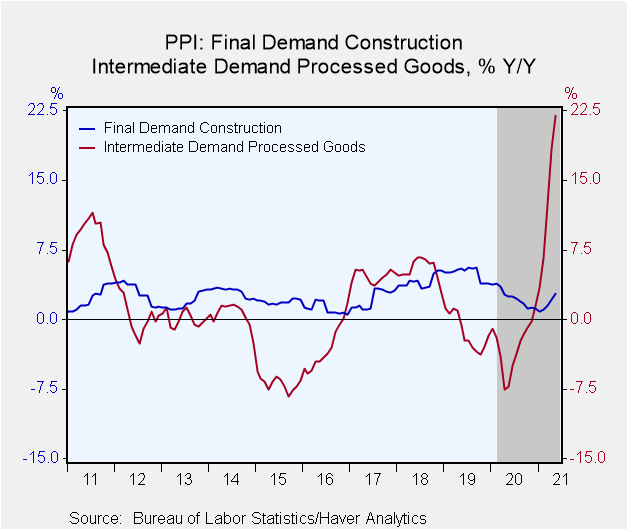
Construction costs increased 0.6% m/m (2.8% y/y) in May, down from the 1.1% m/m gain in April.
Intermediate goods prices jumped 2.8% m/m (21.9% y/y) in May versus a 1.6% m/m rise in April.
The PPI data are published by the Bureau of Labor Statistics and can be found in Haver's USECON database. Further detail is contained in PPI and PPIR. The expectations figures are available in the AS1REPNA database.
| Producer Price Index (SA, %) | May | Apr | Mar | May Y/Y | 2020 | 2019 | 2018 |
|---|---|---|---|---|---|---|---|
| Final Demand | 0.8 | 0.6 | 1.0 | 6.6 | 0.2 | 1.7 | 2.9 |
| Excluding Food & Energy | 0.7 | 0.7 | 0.7 | 4.8 | 0.9 | 2.1 | 2.6 |
| Excluding Food, Energy & Trade Services | 0.7 | 0.7 | 0.6 | 5.3 | 0.7 | 2.0 | 2.8 |
| Goods | 1.5 | 0.6 | 1.7 | 11.1 | -1.4 | 0.4 | 3.4 |
| Foods | 2.6 | 2.1 | 0.5 | 4.4 | 1.3 | 1.9 | 0.2 |
| Energy | 2.2 | -2.4 | 5.9 | 46.6 | -12.8 | -4.6 | 10.2 |
| Goods Excluding Food & Energy | 1.1 | 1.0 | 0.9 | 5.9 | 0.7 | 1.4 | 2.5 |
| Services | 0.6 | 0.6 | 0.7 | 4.5 | 0.9 | 2.3 | 2.6 |
| Trade Services | 0.7 | 0.5 | 1.0 | 3.6 | 1.7 | 2.4 | 1.8 |
| Construction | 0.6 | 1.1 | 0.5 | 2.8 | 2.3 | 5.0 | 4.1 |
| Intermediate Demand - Processed Goods | 2.8 | 1.6 | 4.0 | 21.9 | -2.8 | -1.4 | 5.3 |
Sandy Batten
AuthorMore in Author Profile »Sandy Batten has more than 30 years of experience analyzing industrial economies and financial markets and a wide range of experience across the financial services sector, government, and academia. Before joining Haver Analytics, Sandy was a Vice President and Senior Economist at Citibank; Senior Credit Market Analyst at CDC Investment Management, Managing Director at Bear Stearns, and Executive Director at JPMorgan. In 2008, Sandy was named the most accurate US forecaster by the National Association for Business Economics. He is a member of the New York Forecasters Club, NABE, and the American Economic Association. Prior to his time in the financial services sector, Sandy was a Research Officer at the Federal Reserve Bank of St. Louis, Senior Staff Economist on the President’s Council of Economic Advisors, Deputy Assistant Secretary for Economic Policy at the US Treasury, and Economist at the International Monetary Fund. Sandy has taught economics at St. Louis University, Denison University, and Muskingun College. He has published numerous peer-reviewed articles in a wide range of academic publications. He has a B.A. in economics from the University of Richmond and a M.A. and Ph.D. in economics from The Ohio State University.


