 Global| May 11 2006
U.S. Retail Sales Gain Light
by:Tom Moeller
|in:Economy in Brief
Summary
The 0.5% rise in US retail sales during April was a bit short of Consensus expectations for a 0.7% gain. It followed an unrevised 0.6% rise the prior month. Despite the disappointment, retail sales during the first four months of this [...]
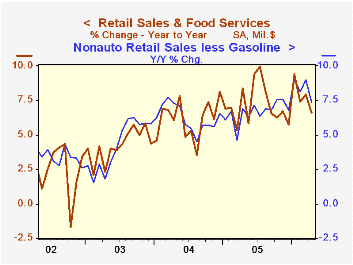
The 0.5% rise in US retail sales during April was a bit short of Consensus expectations for a 0.7% gain. It followed an unrevised 0.6% rise the prior month. Despite the disappointment, retail sales during the first four months of this year rose at a 10.2% annual rate.
Also disappointing was the 0.7% increase in nonauto sales which followed an unrevised 0.4% March rise. Consensus expectations had been for a 0.9% increase. However, that disappointment must be labeled slight given that year to date nonauto sales surged 11.8% (AR) versus an 8.2% rise during all of last year.
Sales at gasoline stations jumped 4.6% (17.4% y/y) as retail gasoline prices rose 13.1% m/m to an April average of $2.74 per gallon.
During April, nonauto retail sales less gasoline rose just 0.2% (7.4% y/y) following an upwardly revised 0.6% March increase. Year to date nonauto retail sales less gasoline rose at a 10.0% annual rate versus a 6.7% increase during 2005.
Sales by motor vehicle & parts dealers fell 0.4% (-0.3% y/y) and reflected a 0.9% m/m increase unit auto sales to 16.74M.
Sales of discretionary items rose moderately led by a 0.8% increase in general merchandise store sales (5.7% y/y). Apparel store sales rose 0.3% (4.5% y/y) but the prior month's modest decline was revised to a 0.4% gain. Sales of furniture, electronics & appliances rose 0.2% (6.9% y/y) and matched an upwardly revised March up tick.
Building material sales retraced all of an upwardly revised 1.6% (+13.0% y/y) March increase while sales of nonstore retailers (internet & catalogue) rose 0.5% (13.3% y/y) following jumps of 2.1% and 3.3% during the prior two months.
| April | Mar | Y/Y | 2005 | 2004 | 2003 | |
|---|---|---|---|---|---|---|
| Retail Sales & Food Services | 0.5% | 0.6% | 6.6% | 7.2% | 6.2% | 4.2% |
| Excluding Autos | 0.7% | 0.5% | 8.6% | 8.2% | 7.2% | 4.7% |
by Tom Moeller May 11, 2006
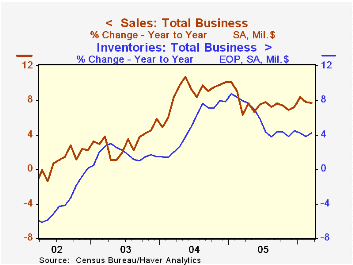
The 0.7% rise in total business inventories during March handily outpaced Consensus expectations for a 0.5% increase. It followed an upwardly revised 0.1% up tick during February and was the strongest rose so far this year.
Retail inventories gained 1.0% after a slight slip during February. Motor vehicle inventories rose 1.7% (1.8% y/y) while less autos, retail inventories rose 0.7%. Strength was led by a 1.9% (7.9% y/y) jump in building materials. Furniture inventories also rose a firm 0.6% (7.2% y/y) and apparel inventories jumped 1.3% (4.1% y/y). Inventories at general merchandise stores slipped for the third straight month (+0.6% y/y). 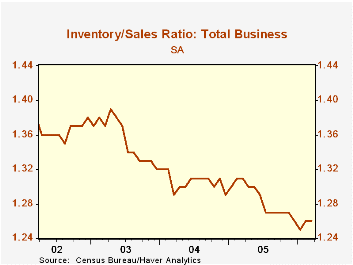
Wholesale inventories rose 0.2% though petroleum inventories fell 2.0%. Durables rose 0.6% (6.6% y/y). During the last ten years there has been a 67% correlation between the y/y change in wholesale inventories and the change in imports of nonpetroleum goods.
Factory sector inventories jumped 0.7% after a 0.4% decline during February.
The inventory to sales ratio for total business was an unrevised 1.26 during February.
| Business Inventories | Mar | Feb | Y/Y | 2005 | 2004 | 2003 |
|---|---|---|---|---|---|---|
| Total | 0.7% | 0.1% | 4.2% | 4.5% | 7.9% | 1.5% |
| Retail | 1.0% | -0.0% | 3.4% | 2.7% | 6.7% | 3.8% |
| Retail excl. Autos | 0.7% | 0.1% | 4.2% | 4.5% | 7.1% | 1.9% |
| Wholesale | 0.2% | 0.9% | 6.3% | 7.1% | 9.8% | 1.8% |
| Manufacturing | 0.7% | -0.4% | 3.4% | 4.4% | 7.7% | -1.1% |
by Tom Moeller May 11, 2006
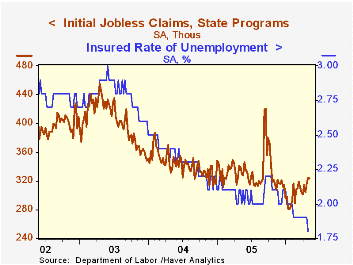
Initial unemployment insurance claims fell 1,000 last week to 324,000 after an upwardly revised 9,000 increase during the prior week. Consensus expectations had been for 315,000 claims.
The four week moving average of initial claims rose to 317,250 (-3.9% y/y).
Continuing claims for unemployment insurance dropped a sharp 49,000 and followed a downwardly revised no change during the prior week.
The insured unemployment rate slipped to 1.8% from 1.9% where it's been since early February.
| Unemployment Insurance (000s) | 05/06/06 | 04/29/06 | Y/Y | 2005 | 2004 | 2003 |
|---|---|---|---|---|---|---|
| Initial Claims | 324 | 325 | -4.4% | 332 | 343 | 403 |
| Continuing Claims | -- | 2,392 | -8.6% | 2,663 | 2,923 | 3,530 |
by Carol Stone May 11, 2006
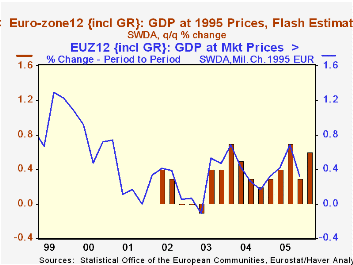
GDP growth picked up in the first quarter for the EuroZone and several individual countries.Eurostat reported this morning that GDP in the EuroZone grew 0.6% over Q4 following 0.3% in that period. The year/year gain was 2.0% from Q1 2005. This is the best since Q2 2004.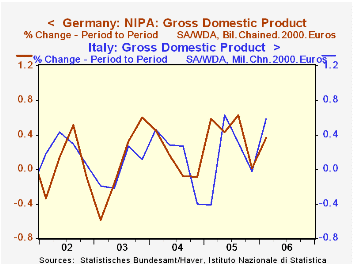
No details are presented in this "flash" estimate, but totals for several constituent countries are available. Germany reported growth of 0.4% in Q1 after no change in Q4. Its yearly growth rate was 1.4%. The German Federal Statistics Office described that a rebound in consumption was the spur to Q1 growth, after its outright decline in Q4. The data for this and other components will be released May 23.
Similarly, Italy's growth bounced by 0.6% after its flat performance in Q4. This produced a 1.5% gain from Q1 2005, the largest increase since Q2 2001. In Spain, growth has been on a much firmer track generally, and it actually ticked down in Q1 to 0.8% from 0.9% in Q4. This still, however, maintained the recent 3.5% year/year pace.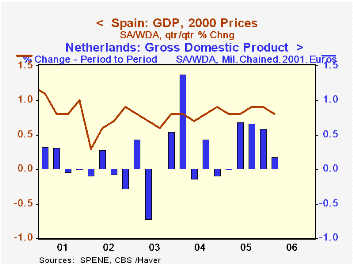
Growth slowed in the Netherlands, to 0.2% from 0.6% in Q4; however, the last three quarters were all at a moderately firm rate, yielding year-on-year growth of 2.1% in Q1, one of the strongest yearly increases since the late 1990s boom period.
The improvements in most of these growth rates seem to confirm the EC Commission's optimism in its latest forecast issued Monday and discussed here by Louise Curley. The Commission raised its outlook for the EuroZone12 by 0.2 percentage points to 2.3% for the year 2006. In the actual Q1 data reported today, perhaps the most important single factor is the gain in Germany; we await the specific figures for private consumption on May 23, but increased spending by the people of Europe's largest nation has to be a help to the entire region. It is all the more significant in light of the accelerating cost of energy.
| GDP | Q1 2006 | Q4 2005 | Q3 2005 | Q1 2005 | 2005 | 2004 | 2003 |
|---|---|---|---|---|---|---|---|
| EU - Flash | 0.6 | 0.3 | 0.7 | 2.0 | 1.4 | 1.8 | 0.7 |
| Germany | 0.4 | 0.0 | 0.6 | 1.4 | 1.2 | 1.1 | -0.2 |
| Italy | 0.6 | -0.0 | 0.3 | 1.5 | 0.1 | 0.9 | 0.1 |
| Spain | 0.8 | 0.9 | 0.9 | 3.5 | 3.4 | 3.1 | 3.0 |
| Netherlands | 0.2 | 0.6 | 0.7 | 2.1 | 1.1 | 1.7 | -0.1 |

Tom Moeller
AuthorMore in Author Profile »Prior to joining Haver Analytics in 2000, Mr. Moeller worked as the Economist at Chancellor Capital Management from 1985 to 1999. There, he developed comprehensive economic forecasts and interpreted economic data for equity and fixed income portfolio managers. Also at Chancellor, Mr. Moeller worked as an equity analyst and was responsible for researching and rating companies in the economically sensitive automobile and housing industries for investment in Chancellor’s equity portfolio. Prior to joining Chancellor, Mr. Moeller was an Economist at Citibank from 1979 to 1984. He also analyzed pricing behavior in the metals industry for the Council on Wage and Price Stability in Washington, D.C. In 1999, Mr. Moeller received the award for most accurate forecast from the Forecasters' Club of New York. From 1990 to 1992 he was President of the New York Association for Business Economists. Mr. Moeller earned an M.B.A. in Finance from Fordham University, where he graduated in 1987. He holds a Bachelor of Arts in Economics from George Washington University.
More Economy in Brief

 Global| Feb 05 2026
Charts of the Week: Balanced Policy, Resilient Data and AI Narratives
by:Andrew Cates

