 Global| Sep 11 2012
U.S. Trade Balance on Goods and Services, A Bit Better than Expected
Summary
The Department of Commerce announced today that the U. S. trade balance on goods and services was -$42.0 billion in July, slightly worse than the revised June figure of -$41.9 billion. Exports of goods and services were $183.l billion [...]
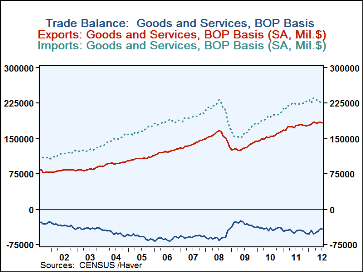
The Department of Commerce announced today that the U. S. trade balance on goods and services was -$42.0 billion in July, slightly worse than the revised June figure of -$41.9 billion. Exports of goods and services were $183.l billion July compared with $185.2 billion in June. Imports of goods and services were also lower in July, $225.3 billion compared with $227.1 billion in June. The consensus, as reported by Action Economics Forecast Survey, was looking for deficit of $44.4 billion, with exports at $184.8 billion and imports at $229.1 billion. Exports and imports of goods and services and the balances are shown in the first chart.
Traditionally, the U. S. runs a deficit on goods and a surplus on services. The balance on goods actually improved by $168 billion from -$57,429 million in June to -$57,259 million in July while the balance on services deteriorated by $271 million from a surplus of $15,528 million in June to one of $15,257 million in July.
Although exports of goods and services dipped in July, they were 2.8% above July of 2011. Among the increases in exports from a year ago were foods, feeds, and beverages, $2.5 billion; capital goods, $2.3 billion; consumer goods; $0.9 billion and autos, auto parts and engines, $0.5 billion. Industrial supplies and materials declined by $2.0 billion. Among the increases in imports from a year ago were autos, auto parts and engines, $3.6 billion and capital goods, $2.5 billion. Imports of industrial supplies and materials decreased by $6.0 billion.
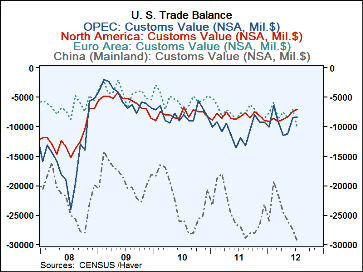
Some changes in the trade balances with selected areas and countries are shown in the second chart. The trade deficits between the U. S. and China and the Euro Area continue to worsen and are currently at all time highs--the U.S. trade deficit with the Euro Area. in July at $10.9 billion and that with China, at $29.3 billion. There has been a big improvement in the trade deficits with OPEC. In July the trade deficit with OPEC was $8.3 billion down from the peak of $13.6 billion in June 2011 and there has been improvement in the deficit with North America that was $7.1 billion, the lowest since the $6.7 billion of July 2010.
| US Trade in Goods and Services | ||||||||
|---|---|---|---|---|---|---|---|---|
| Jul'12 | Jun'12 | Jul'11 | M/M | Y/Y | 2011 | 2010 | 2009 | |
| Exports of Goods and Service (Billions of US$) | 183.3 | 185.2 | 178.4 | -1.0 | 2.8 | 2103.4 | 1812.5 | 1578.9 |
| Imports of Goods and Services | 225.3 | 227.1 | 223.9 | -0.8 | 0.6 | 2663.2 | 2337.2 | 1958.1 |
| Balance on Goods and Services | 42.0 | 41.9 | 45.6 | -0.1* | 3.6* | -556.9 | -494.7 | -379.2 |
| * Change in dollar amounts | ||||||||
More Economy in Brief
 Global| Feb 05 2026
Charts of the Week: Balanced Policy, Resilient Data and AI Narratives
by:Andrew Cates


