 Global| Jun 10 2005
U.S. Trade Deficit Deteriorated
by:Tom Moeller
|in:Economy in Brief
Summary
The U.S. foreign trade deficit deepened in April to $57.0B and reversed about half of the prior month's m/m improvement which was revised. Consensus expectations had been for a deficit of $58.0B. Total exports doubled the prior [...]
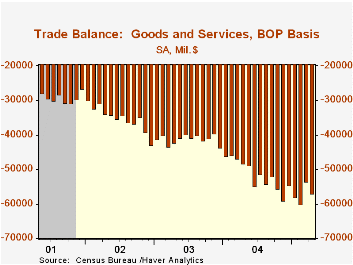
The U.S. foreign trade deficit deepened in April to $57.0B and reversed about half of the prior month's m/m improvement which was revised. Consensus expectations had been for a deficit of $58.0B.
Total exports doubled the prior month's gain and rose 3.0%. Goods exports increased 4.2% (12.7% y/y) to a record high. Exports of capital goods led the gain with a 5.5% jump (12.1% y/y) Exports of advanced technology products fell 4.3% (NSA, +14.2% y/y) after the prior month's one third jump higher. Exports of nonauto consumer goods fell for the second month (+9.1% y/y) but exports of foods, feeds & beverages rose 3.5% (5.3% y/y).
Services exports 0.2% (12.5% y/y).
Total imports recovered all of the prior moth's slump with a 4.1% increase as imports of petroleum products surged 4.3% (48.9% y/y). The average price of crude oil jumped another 8.8% to $44.76 per bbl. (44.4% y/y). Imports of non-petroleum goods recovered all of the prior month's drop with a 5.0% (10.8% y/y) as capital goods imports jumped 7.6% (14.0% y/y).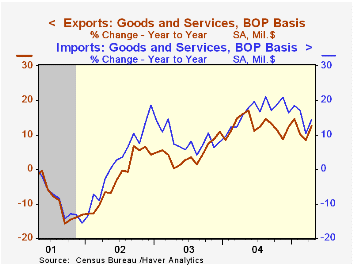
The US trade deficit with China deteriorated slightly to $14.7B ($162.0B in 2004) due to an 11.8% jump in imports (22.9% y/y). The US trade deficit with Japan improved slightly to $7.2B ($75.2B in 2004) and the monthly trade deficit with the Asian NICs deepened to $0.8B ($21.9B in 2004). The US trade deficit with the European Union eased slightly to $9.3B ($110.0B in 2004).
Yesterday's testimony on the Economic Outlook from Fed Chairman Greenspan can be found here.
Are We Underestimating the Gains from Globalization for the United States? from the Federal Reserve Bank of New York is available here.
| Foreign Trade | April | March | Y/Y | 2004 | 2003 | 2002 |
|---|---|---|---|---|---|---|
| Trade Deficit | $57.0B | $53.6B | $48.4B (4/04) | $617.6B | $494.8B | $421.2B |
| Exports - Goods & Services | 3.0% | 1.6% | 12.7% | 12.6% | 4.6% | -3.0% |
| Imports - Goods & Services | 4.1% | -3.1% | 14.4% | 16.6% | 8.5% | 2.1% |
by Tom Moeller June 10, 2005
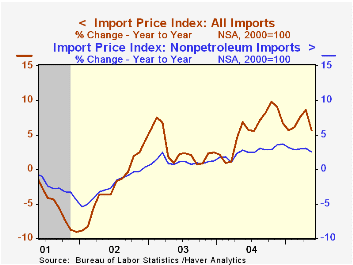
Import prices fell 1.3% last month after an upwardly revised 1.2% April surge. Consensus expectations had been for a 0.4% decline.
Petroleum prices slumped 6.5% in May and were the source of April's upward revision. In June, crude oil prices have recovered all of the May decline and moved to $53.18 for Brent Crude.
Import prices other than petroleum fell 0.3% last month though price declines were limited.
Prices for nonauto consumer goods rose 0.1% (+1.4% y/y) but capital goods prices were unchanged (-0.3% y/y). Excluding computers capital goods prices rose another 0.3% (2.7% y/y).
During the last ten years there has been a 66% (negative) correlation between the nominal trade-weighted exchange value of the US dollar vs. major currencies and the y/y change in non oil import prices. The correlation is a lower 47% against a broader basket of currencies and a lower 57% against the real value of the dollar.
Export prices reversed some of the prior month's gain with a 0.1% decline.
| Import/Export Prices (NSA) | May | April | Y/Y | 2004 | 2003 | 2002 |
|---|---|---|---|---|---|---|
| Import - All Commodities | -1.3% | 1.2% | 5.7% | 5.6% | 2.9% | -2.5% |
| Petroleum | -6.5% | 5.4% | 26.2% | 30.5% | 21.0% | 3.0% |
| Non-petroleum | -0.3% | 0.4% | 2.5% | 2.6% | 1.1% | -2.4% |
| Export - All Commodities | -0.1% | 0.6% | 2.7% | 3.9% | 1.6% | -1.0% |
by Carol Stone June 10, 2005
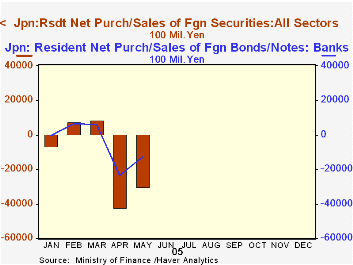
Japan's Ministry of Finance (MoF) has reorganized its data on the purchase and sales of foreign securities by Japanese investors and the similar data on foreign investment in Japanese securities. The new data began this past January and are designed to mesh better with the balance of payments. They are contained in Haver's "JAPAN" database and summary statistics are available weekly in JAPANW.
In the table below, we show total purchases and sales of foreign securities by Japanese investors. In May, Japanese residents bought ¥14.4 trillion worth and sold ¥11.4 trillion, making net purchases of ¥3.0 trillion. This figure appears in the table with a minus (-) sign. This convention is in line with balance of payments practices that treat these transactions according to the direction of the flow of capital. With net purchases, then, there is a net outflow of money and the sign is minus (-). In February and March, sales exceeded purchases, so there was a net inflow of money into Japan and the sign of the net figure is plus (+).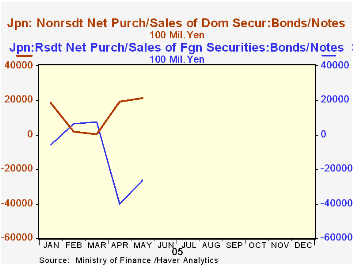
The bulk of the new securities investment abroad is in bonds and notes; this is typical, according to the old data, which was discontinued with the December 2004 figures. Further, as seen in the first graph, banks take a substantial share of this investment activity. With only five months of the new data, we can't judge trends yet, of course, but it does seem here than when the new Japanese fiscal year started in April, investment abroad picked up significantly. At the same time, foreign investors stepped up their net purchases of Japanese securities in April and May as well. Here, net purchases have the expected plus (+) sign, since they represent a net inflow of funds into Japan. Japanese investment abroad is larger, but a point we highlight here is that there are active flows of capital and financial assets in both directions, illustrating the diversity of interests in world capital markets.
| Japan (Trillion ¥) | May 2005 | Apr 2005 | Mar 2005 | Feb 2005 | Jan 2005 |
|---|---|---|---|---|---|
| Purchases | 14.372 | 14.915 | 10.348 | 10.631 | 10.728 |
| Sales | 11.351 | 10.681 | 11.171 | 11.410 | 10.064 |
| Net Purchases/ Sales | -3.017 | -4.234 | +0.824 | +0.779 | -0.664 |
| Bonds & Notes | -2.626 | -4.003 | +0.768 | +0.648 | -0.589 |
| Equities | -0.254 | -0.199 | -0.059 | +0.031 | -0.151 |
| Money Market Instruments | -0.138 | -0.032 | +0.114 | +0.010 | +0.075 |

Tom Moeller
AuthorMore in Author Profile »Prior to joining Haver Analytics in 2000, Mr. Moeller worked as the Economist at Chancellor Capital Management from 1985 to 1999. There, he developed comprehensive economic forecasts and interpreted economic data for equity and fixed income portfolio managers. Also at Chancellor, Mr. Moeller worked as an equity analyst and was responsible for researching and rating companies in the economically sensitive automobile and housing industries for investment in Chancellor’s equity portfolio. Prior to joining Chancellor, Mr. Moeller was an Economist at Citibank from 1979 to 1984. He also analyzed pricing behavior in the metals industry for the Council on Wage and Price Stability in Washington, D.C. In 1999, Mr. Moeller received the award for most accurate forecast from the Forecasters' Club of New York. From 1990 to 1992 he was President of the New York Association for Business Economists. Mr. Moeller earned an M.B.A. in Finance from Fordham University, where he graduated in 1987. He holds a Bachelor of Arts in Economics from George Washington University.
More Economy in Brief

 Global| Feb 05 2026
Charts of the Week: Balanced Policy, Resilient Data and AI Narratives
by:Andrew Cates

