 Global| Aug 11 2011
U.S. Trade Deficit Falls as Exports Decline
Summary
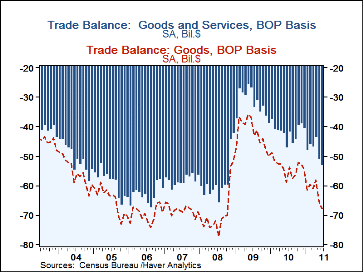
The foreign trade deficit widened to $53.1B in June from a little-revised $50.8B in May. Expectations had been for $48.0B, according to Action Economics. The latest figure eclipsed May's as the deepest since October 2008. Exports fell [...]
The foreign trade deficit widened to $53.1B in June from a little-revised $50.8B in May. Expectations had been for $48.0B, according to Action Economics. The latest figure eclipsed May's as the deepest since October 2008. Exports fell 2.3%, or $4.1B in June, while imports also decreased but by just 0.8%, or $1.9B. In chained 2005 dollars, the overall deficit in goods was $50.9B, wider than May's $47.9B; real exports dropped 3.3% and real imports edged 0.2% lower.
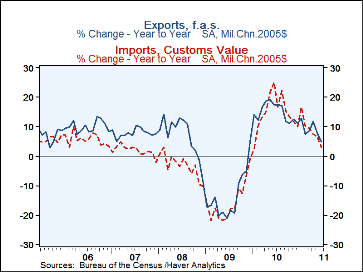
The $4.1B drop in exports in June still left them 12.9% ahead of June 2010 was almost totally accounted for by a $4.1B decrease in goods.& This occurred in food & beverages, industrial materials, capital goods and "other". Exports increased among nonauto consumer goods, which gained 5.2% on the month; auto exports edged up 0.4% from May.
Services exports were virtually flat overall, edging down a mere 0.08%, although they were fairly mixed by type. Gains took place in royalties and license fees, "other" services, and military sales contracts, while there were decreases in travel, passenger fares and other transportation charges.
Overall imports decreased 0.8% and were 13.9% ahead of last June. Goods imports were down 1.0% in the month but still up 14.7% from June 2010. Month-to-month declines were pretty widespread, especially for industrial materials, which fell $2.2B in June, a 3.3% monthly decrease; this end-use category includes petroleum, about which we have more to say in the next paragraph. There were modest decreases in capital goods, autos and nonauto consumer goods. Imports of foods and "other" goods were both up. Much of the decline in imports owes to lower oil prices. A calculated price deflator on total goods imports fell 0.8%; the volume of goods imports was off just 0.2%.
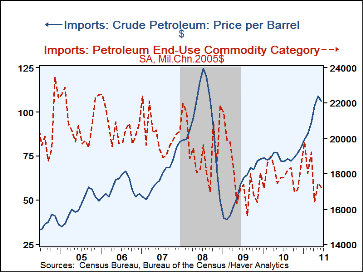
The value of June's petroleum imports fell 4.3%, following May's surge of 10.8%; the June amount was 42.2% larger than in June 2010. The cost of crude oil per barrel fell $2.70 to $106.00 from May's $108.70; in June 2010, the average price was $72.39. June's volume of energy-related petroleum imports averaged 12.2 million barrels/day, up from 11.3 million in May; June included 9.9 million barrels of crude oil, up from 8.9 million in May. Despite the monthly increase, both of these are lower than a year ago, the total by 4.5% and crude by 5.3%.
Imports of services rose just 0.1%, putting them 3.6% ahead of a year ago. The three transportation categories, travel, passenger fares and "other", all decreased slightly in June, making their total down 0.4% in the month, although it is still 4.0% higher than a year ago. The other items, royalties & license fees, "other" and U.S. defense-related outlays were each up 0.4% or 0.5%.
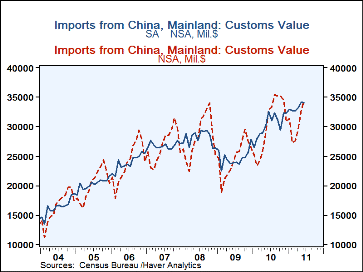
By country, the goods trade deficit with China widened to $26.7B. Imports from there were up $1.6B, or 4.9%, from May, and exports edged down $88 million, or 1.1%. While this wider deficit might be disturbing, it may well be that the import gain is mainly seasonal. The seasonal adjustment function in Haver's DLXVG3 software runs a quick, standardized X-12 routine on the currently chosen series, and this shows (see graph) that such seasonally adjusted imports were actually down slightly from May. The NSA series makes clear that imports from there generally rise markedly through the summer as merchandise for Christmas shopping is delivered.
The international trade data can be found in Haver's USECON database. Detailed figures are available in the USINT database. The expectations figures are from the Action Economics consensus survey, which is carried in the AS1REPNA database.
| Foreign Trade | June | May | Apr | Y/Y | 2010 | 2009 | 2008 |
|---|---|---|---|---|---|---|---|
| U.S. Trade Deficit | $53.1B | $50.2B | $43.6B | $42.2B (6/10) |
$500.0B | $381.3B | $698.3B |
| Exports-Goods & Services | $170.8B | $175.0B | $175.8B | $151.3B | $1,837.6B | $1,575.0B | $1,842.7B |
| Month/Month % Chg | -2.3% | -0.5% | 1.4% | 15.0% | 16.7% | -14.5% | 11.4% |
| Imports-Goods & Services | $223.9B | $225.8B | $219.4B | $198.2B | $2,337.6B | $1,956.3B | $2,541.0B |
| Month/Month %Chg | -0.8% | 2.6% | -0.3% | 15.9% | 19.5% | -23.0% | 8.1% |
| Petroleum | -4.3 | 10.3 | -5.3 | 41.9 | 32.5 | -44.0 | 37.0 |
| Nonpetroleum goods | -0.1 | 0.9 | 0.7 | 0.9 | 20.8 | -20.9 | 1.5 |
Carol Stone, CBE
AuthorMore in Author Profile »Carol Stone, CBE came to Haver Analytics in 2003 following more than 35 years as a financial market economist at major Wall Street financial institutions, most especially Merrill Lynch and Nomura Securities. She has broad experience in analysis and forecasting of flow-of-funds accounts, the federal budget and Federal Reserve operations. At Nomura Securites, among other duties, she developed various indicator forecasting tools and edited a daily global publication produced in London and New York for readers in Tokyo. At Haver Analytics, Carol is a member of the Research Department, aiding database managers with research and documentation efforts, as well as posting commentary on select economic reports. In addition, she conducts Ways-of-the-World, a blog on economic issues for an Episcopal-Church-affiliated website, The Geranium Farm. During her career, Carol served as an officer of the Money Marketeers and the Downtown Economists Club. She has a PhD from NYU's Stern School of Business. She lives in Brooklyn, New York, and has a weekend home on Long Island.


