 Global| Mar 07 2018
U.S. Trade Deficit Increases Due to Decline in Exports
Summary
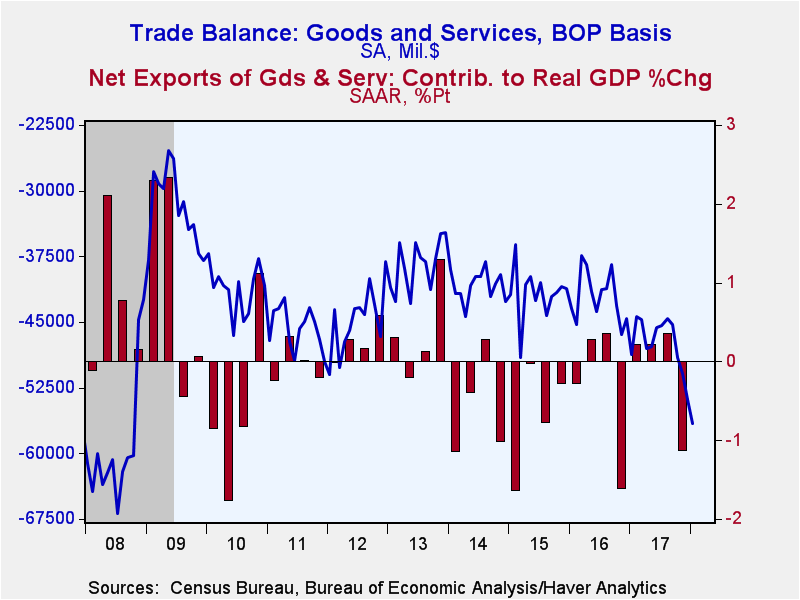
The U.S. trade deficit in goods and services widened to $56.6 billion in January from $53.9 billion in December, revised from $53.1 billion. A $54.1 billion deficit had been expected in the Action Economics Forecast Survey. Exports [...]
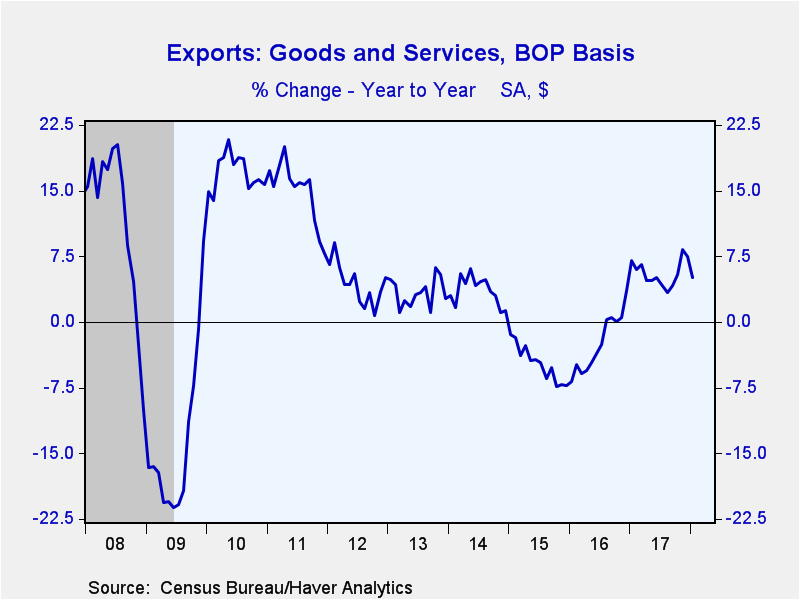
The U.S. trade deficit in goods and services widened to $56.6 billion in January from $53.9 billion in December, revised from $53.1 billion. A $54.1 billion deficit had been expected in the Action Economics Forecast Survey. Exports fell 1.3% (+5.1% y/y) following a 1.7% rise while imports were virtually unchanged (+7.4% y/y).
The deficit on goods trade rose to $76.5 billion in January, again biggest since July 2008. Exports of goods fell 2.2% (5.3% y/y) following a 2.4% rise. Several end-use categories participated in the decline. Capital goods ex autos had the biggest drop, 5.4% (+3.4% y/y). Industrial materials and supplies were down 3.1% (+10.2% y/y) and foods, feeds & beverages were off 0.7% (-2.9% y/y). "Other" goods exports dropped 17.6% (+7.4% y/y). Autos & parts exports, in contrast, rose 3.6% (+2.2% y/y) and nonauto consumer goods gained 7.0% (+8.6% y/y.
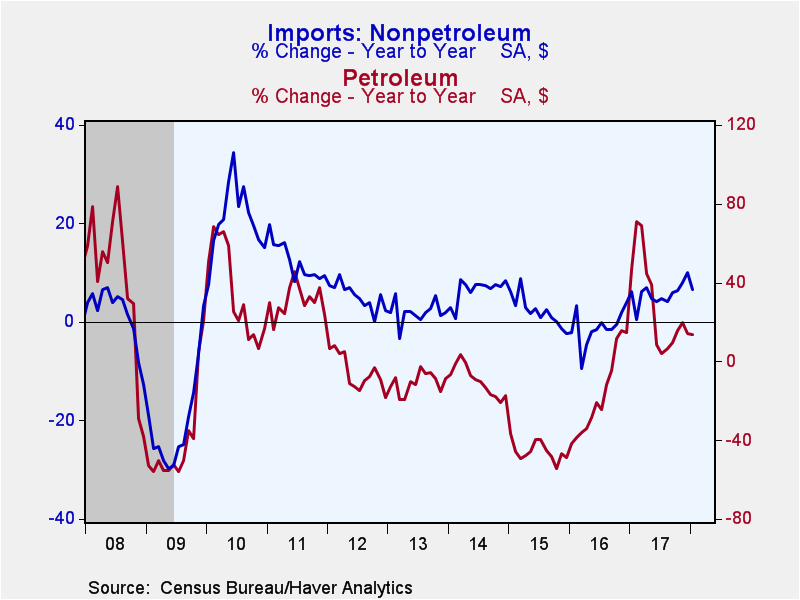
Imports of goods eased 0.1% in January (+7.2% y/y) following a 2.9% gain. Only one category rose: industrial materials and supplies gained 4.3% (+13.4% y/y). Others were all down to varying degrees: capital goods ex autos dropped 2.3% (+0/8% y/y) and nonauto consumer goods imports fell 1.6% (+5.0% y/y). "Other" goods imports eased 0.7% (+8.1% y/y), while there were marginal decreases in foods, feeds & beverages, -0.1% (+6.6% y/y), and autos & parts, -0.02% (-1.1% y/y)
The increase in imports of industrial supplies includes a 20.6% surge in petroleum imports (+13.5% y/y) following December's decline of 6.2%. All non-petroleum goods imports fell by 1.6% (+6.6% y/y) in January after December's rise of 3.7%. The value of energy-related petroleum imports rose 20.8% (+15.1% y/y), reflecting a 5.1% increase in the per barrel cost of crude oil to $54.76 (24.6% y/y), the highest level since January 2015. The quantity of energy-related petroleum imports jumped 14.9% (-6.3% y/y), rebounding after a 10.1% drop in December.
By commodity, imports of iron & steel, currently the subject the possible imposition of tariffs, amounted to $1.243 billion in January, up from $1.100 billion in December. For all of 2017, iron & steel imports totaled $14.666 billion. Imports of non-ferrous metals, which would include aluminum, were $1.349 billion in January compared to $1.161 billion in December and $14.227 billion in all of 2017.
The surplus on services trade edged up to $19.9 billion in January from $19.8 billion in December and compares to $20.3 billion in January 2017. Services exports increased 0.4% (+4.7% y/y) after a 0.2% rise the month before. Travel is the largest service export category, at $17.0 billion in January, and it has moved little recently, up 0.1% in both December and January and down 1.6% from January 2017. The biggest gain this January was in transport services, up 1.2% (+4.0% y/y), after December's 1.0% decline.
Imports of services rose 0.4% (+7.9% y/y) after December's 1.1% advance. U.S. residents' travel abroad is the largest category, $11.5 billion; that was down 1.4% in January (+5.4% y/y) following a 1.9% surge in December. Transport charges rose 1.3% (+4.7% y/y) after a 2.3% gain in December and telecommunications charges grew 1.0% (+9.0% y/y) after 0.8% the prior month.
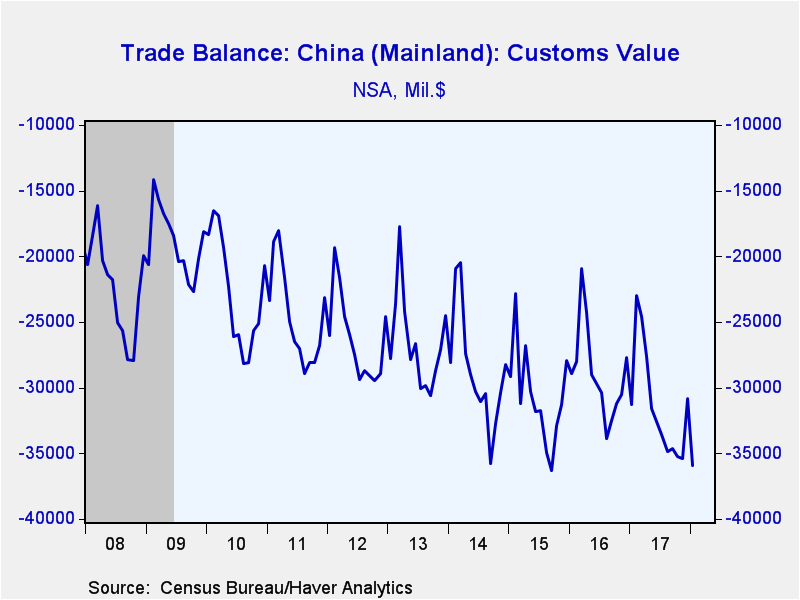
By country, the goods trade deficit with China widened to $36,0 billion in January (NSA) after $30.8 billion in December. The deficit with the European Union narrowed to $13.6 billion (NSA) in January from $15.8 billion the month before. The trade deficit with Japan increased modestly to $5.7 billion from December's $5.5 billion.
The international trade data can be found in Haver's USECON database. Detailed figures are available in the USINT database. The expectations figures are from the Action Economics Forecast Survey, which is carried in AS1REPNA.
| Foreign Trade in Goods & Services (Current Dollars) | Jan | Dec | Nov | Y/Y | 2017 | 2016 | 2015 |
|---|---|---|---|---|---|---|---|
| U.S. Trade Deficit | $56.6 bil. | $53.9 bil. | $50.9 bil. | $48.7 bil. (1/17) |
$568.4 bil. | $504.8 bil. | $500.4 bil. |
| Exports of Goods & Services (% Chg) | -1.3 | 1.7 | 2.3 | 5.1 | 5.6 | -2.5 | -4.7 |
| Imports of Goods & Services (% Chg) | -0.0 | 2.6 | 2.6 | 7.4 | 6.9 | -1.9 | -3.6 |
| Petroleum (% Chg) | 20.6 | -6.2 | 10.1 | 13.5 | 27.0 | -19.4 | -45.5 |
| Nonpetroleum Goods (% Chg) | -1.9 | 3.7 | 2.4 | 6.7 | 5.7 | -1.2 | 2.2 |
Carol Stone, CBE
AuthorMore in Author Profile »Carol Stone, CBE came to Haver Analytics in 2003 following more than 35 years as a financial market economist at major Wall Street financial institutions, most especially Merrill Lynch and Nomura Securities. She has broad experience in analysis and forecasting of flow-of-funds accounts, the federal budget and Federal Reserve operations. At Nomura Securites, among other duties, she developed various indicator forecasting tools and edited a daily global publication produced in London and New York for readers in Tokyo. At Haver Analytics, Carol is a member of the Research Department, aiding database managers with research and documentation efforts, as well as posting commentary on select economic reports. In addition, she conducts Ways-of-the-World, a blog on economic issues for an Episcopal-Church-affiliated website, The Geranium Farm. During her career, Carol served as an officer of the Money Marketeers and the Downtown Economists Club. She has a PhD from NYU's Stern School of Business. She lives in Brooklyn, New York, and has a weekend home on Long Island.


