 Global| May 12 2006
U.S. Trade Deficit Lower: Exports Surged, Oil Prices Fell
by:Tom Moeller
|in:Economy in Brief
Summary
The U.S. foreign trade deficit fell to $62.0B during March, the lowest level since last August. The decline exceeded Consensus expectations for a deficit of $67.0B. Total exports recovered from the prior month's drop with a 1.9% jump [...]
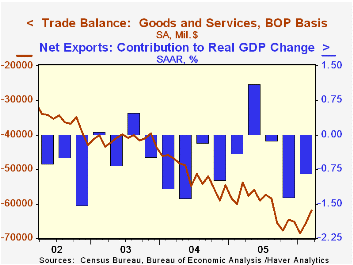
The U.S. foreign trade deficit fell to $62.0B during March, the lowest level since last August. The decline exceeded Consensus expectations for a deficit of $67.0B.
Total exports recovered from the prior month's drop with a 1.9% jump led by a 1.5% (16.0% y/y) surge in capital goods exports. Exports of advanced technology products led that gain and surged 24.2% (NSA, 17.3% y/y). Nonauto consumer goods exports also were strong and rose 1.7% (12.0% y/y). Exports of industrial supplies & materials posted outsized strength with a 6.0% (18.0% y/y) increase that was offset by a 4.2% (+11.3% y/y) decline in automotive exports.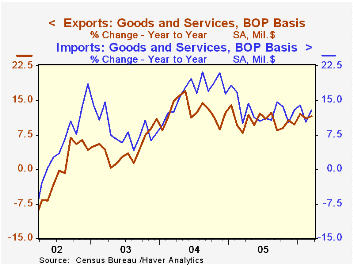
Imports contracted by 0.8% during March, pulled down by an 8.3% (+21.0% y/y) drop in petroleum imports. That seasonally adjusted decline reflected a 7.4% (-4.1% y/y) rise in the quantity of crude oil imports and 5.1% rise in the quantity of all energy-related petroleum product imports. Crude oil prices dropped 2.7% (+27.0% y/y) to an average $52.26 per bbl. Brent crude oil prices have since risen to an average $71.49 per barrel this month from an average $69.51 in April and $61.71 during March.
Imports of capital goods reversed a February decline with a 4.5% (15.1% y/y) increase. Imports of advanced technology products jumped 27.9% (NSA, 20.9% y/y) while nonauto consumer goods imports rose 2.5% (13.0% y/y).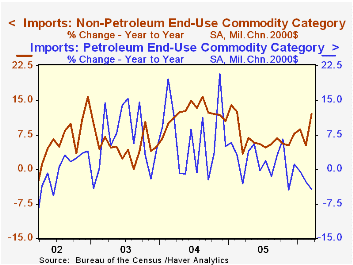
The US trade deficit with China deepened to $15.6B ($201.6B for 2005) and the trade deficit with Japan rose to $7.6B ($82.7B in 2005). The trade deficit with the Asian NICs halved again versus February to $0.5B ($15.9B in 2005). The deficit with the European Union deepened sharply to $10.1B ($122.4B in 2005) after four months of narrowing.
Racing To The Top: How Global Competition Disciplines Public Policy from the Federal Reserve Bank of Dallas can be found here.
| Foreign Trade | Mar | Feb | Y/Y | 2005 | 2004 | 2003 |
|---|---|---|---|---|---|---|
| Trade Deficit | $62.0B | $65.5B | $53.7B (3/05) | $723.6B | $617.6B | $494.8B |
| Exports - Goods & Services | 1.9% | -1.6% | 11.6% | 10.5% | 12.6% | 4.6% |
| Imports - Goods & Services | -0.8% | -2.6% | 12.9% | 12.8% | 16.6% | 8.5% |
by Tom Moeller May 12, 2006
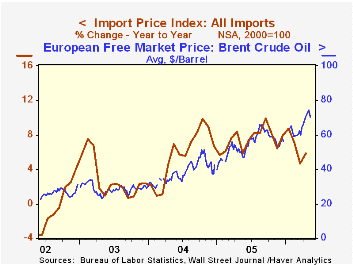
Total import prices jumped 2.1% last month following declines during the prior two months. The gain was nearly double consensus expectations for a 1.1% increase.
Petroleum prices were notably strong and rose 11.5% (32.5% y/y). Nonpetroleum import prices also firmed and were unchanged after two consecutive months of decline.
Industrial materials prices less petroleum rose 0.5% (6.1% y/y) after two months of sharp decline. Prices for nonauto consumer goods fell 0.2% (-0.3% y/y) and capital goods prices were unchanged for the third consecutive month (-1.5% y/y). Excluding a 0.4% decline in computer prices, capital goods prices rose 0.1% for the second month (0.7% y/y).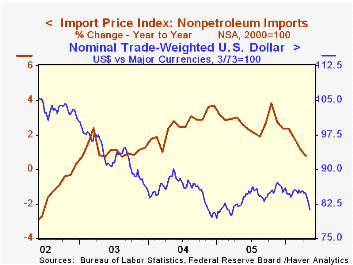
During the last ten years there has been a 66% (negative) correlation between the nominal trade-weighted exchange value of the US dollar vs. major currencies and the y/y change in non oil import prices. The correlation is a lower 47% against a broader basket of currencies and a lower 57% against the real value of the dollar.
Export prices rose 0.6%, the strongest increase since January.
| Import/Export Prices (NSA) | April | Mar | Y/Y | 2005 | 2004 | 2003 |
|---|---|---|---|---|---|---|
| Import - All Commodities | 2.1% | -0.2% | 5.9% | 7.5% | 5.6% | 2.9% |
| Petroleum | 11.5% | 0.5% | 32.5% | 37.6% | 30.5% | 21.0% |
| Non-petroleum | 0.0% | -0.3% | 0.8% | 2.7% | 2.6% | 1.1% |
| Export - All Commodities | 0.6% | 0.2% | 2.4% | 3.2% | 3.9% | 1.6% |
by Tom Moeller May 12, 2006
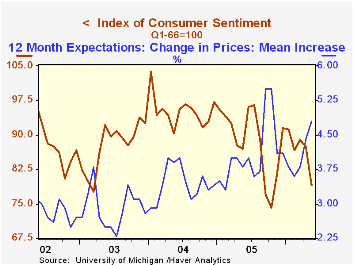
Consumer sentiment fell hard early this month. The preliminary May reading from the University of Michigan dropped 9.6% m/m to 79.0, the lowest level since last October. Consensus expectations had been for a far lesser decline to 86.8. During the last ten years there has been a 76% correlation between the level of consumer sentiment and the y/y change in real consumer spending.
Expectations for the economy dropped 7.4% on top of a 3.3% April decline. Higher gasoline prices probably were behind the jump in the twelve month mean expected inflation rate to 4.8% from 4.4% last month, its highest level since October. That dragged down expectations for personal finances as well as expected business conditions.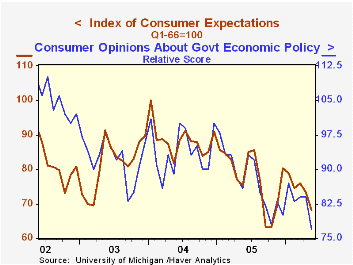
The current conditions index also suffered and fell 11.9% m/m. The current index of personal finances dropped 16.0% (-8.3% y/y) and the reading of buying conditions for large household goods fell 9.7% (-8.6% y/y). Consumers' assessment of gov't economic policy cratered 8.3% m/m (-10.5% y/y).
The University of Michigan survey is not seasonally adjusted.The mid-month survey is based on telephone interviews with 250 households nationwide on personal finances and business and buying conditions. The survey is expanded to a total of 500 interviews at month end.
Household energy expenditures, 1982-2005 from the Federal Reserve Bank of Chicago is available here.
| University of Michigan | May (prelim. | April | Y/Y | 2005 | 2004 | 2003 |
|---|---|---|---|---|---|---|
| Consumer Sentiment | 79.0 | 87.4 | -9.1% | 88.6 | 95.2 | 87.6 |
| Current Conditions | 96.2 | 109.2 | -8.3% | 105.9 | 105.6 | 97.2 |
| Expectations | 68.0 | 73.4 | -9.7% | 77.4 | 88.5 | 81.4 |
by Carol Stone May 12, 2006
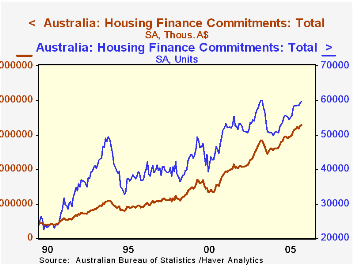
After some contraction in 2004, home finance in Australia has strengthened considerably. In data reported at midday May 12 in Canberra, the Australian Bureau of Statistics (ABS) indicated that housing commitments totaled 59,724 in March, up 423 from February and 7.5% from March 2005. The value of these commitments was A$13,124.4 million, up 11% from the year-earlier month.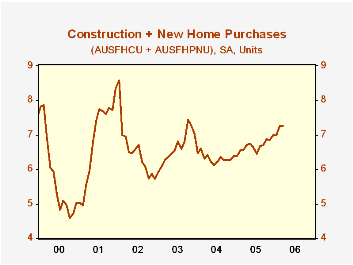
In the table below, we show the finance commitment data by purpose. We have combined it a bit differently than ABS presents. We added construction commitments to those for the purchase of new homes; this "new home financing" was nearly flat in March, up just 0.2%, but these commitments are up 10.5% from a year ago. ABS's measure of existing home purchase commitments includes those for refinancing, but we have pulled them out, so the entry in our table includes only actual purchases of "established dwellings". These financing commitments were up 0.9% for the month and 7.3% for the year.
The number of commitments for refinancing was 17,509 in March, 0.5% larger than in February and, moderating a bit, just 6.7% above March 2005. The volume of refinancing activity hit a peak during 2003, just a few months after a trough in interest rates, shown in the graph using 10-year Treasury bonds. Looking at this interest rate with a 6-month lead, we see a substantial 76% negative correlation with refinancing activity since 2000.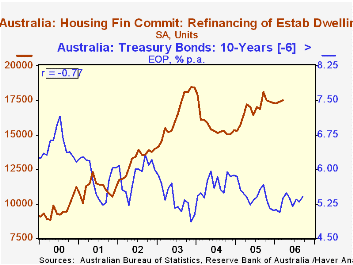
The number of existing home purchase commitments also peaked during 2003, and are only now re-approaching that amount.
These data are contained in Haver's ANZ database. All of the various calculations discussed above are made using DLXVG3. We can add or subtract two series and take growth rates on the newly constructed series, just as with the original ones. We can also edit the title to match the calculation, using the Graph dropdown menu item "Titles". Lead and lags in a series are implemented using CTRL together with the left- or right-arrow key.
| Australia: Housing Finance Commitments, SA | Mar 2006 | Feb 2006 | Jan 2006 | Mar 2005 | Monthly Averages|||
|---|---|---|---|---|---|---|---|
| 2005 | 2004 | 2003 | |||||
| Total Units (000s) | 59.72 | 59.30 | 58.46 | 55.57 | 56.11 | 51.18 | 56.66 |
| Value (Bil.A$) | $13.124 | $13.040 | $12.731 | $11.829 | $12.046 | $10.400 | $10.336 |
| Construction + Purchase of Newly Built Houses (000s) | 7.27 | 7.25 | 6.99 | 6.58 | 6.68 | 6.33 | 6.63 |
| Purchase of Established Houses (000s)* | 34.95 | 34.63 | 34.22 | 32.58 | 32.56 | 29.21 | 33.55 |
| Refinance of Established Houses (000s) | 17.51 | 17.42 | 17.26 | 16.41 | 16.86 | 15.64 | 16.48 |

Tom Moeller
AuthorMore in Author Profile »Prior to joining Haver Analytics in 2000, Mr. Moeller worked as the Economist at Chancellor Capital Management from 1985 to 1999. There, he developed comprehensive economic forecasts and interpreted economic data for equity and fixed income portfolio managers. Also at Chancellor, Mr. Moeller worked as an equity analyst and was responsible for researching and rating companies in the economically sensitive automobile and housing industries for investment in Chancellor’s equity portfolio. Prior to joining Chancellor, Mr. Moeller was an Economist at Citibank from 1979 to 1984. He also analyzed pricing behavior in the metals industry for the Council on Wage and Price Stability in Washington, D.C. In 1999, Mr. Moeller received the award for most accurate forecast from the Forecasters' Club of New York. From 1990 to 1992 he was President of the New York Association for Business Economists. Mr. Moeller earned an M.B.A. in Finance from Fordham University, where he graduated in 1987. He holds a Bachelor of Arts in Economics from George Washington University.
More Economy in Brief

 Global| Feb 05 2026
Charts of the Week: Balanced Policy, Resilient Data and AI Narratives
by:Andrew Cates

