 Global| Nov 08 2012
U.S. Trade Deficit Narrows in September as Exports Rebound
Summary
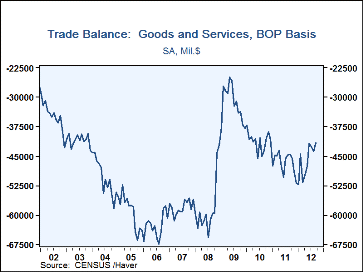
The U.S. foreign trade deficit eased to $41.5B in September from $43.8B in August, revised from $44.1B. This was noticeably better than the Action Economics consensus forecast increase to $45.0B. This was also the most favorable [...]
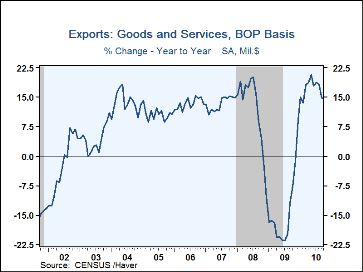
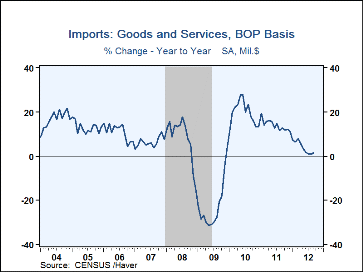
The U.S. foreign trade deficit eased to $41.5B in September from $43.8B in August, revised from $44.1B. This was noticeably better than the Action Economics consensus forecast increase to $45.0B. This was also the most favorable balance since December 2010. The September improvement came in a rebound in exports to $187.0B, up 3.1% from August and 3.5% from a year ago. Imports also increased, by 1.5%, to $228.5B, also up 1.5% from a year ago. In chained 2005 dollars, the deficit in goods improved to $46.8B from $48.2B in August. Real exports were up 3.1% (+4.3% y/y) after falling 2.6% in August, while real imports increased 1.2% (+3.1% y/y), reversing a 1.1% decline the previous month.
The rebound in real exports came in food, feeds and beverages, up 7.9%, industrial materials and supplies, up 6.1%, and nonauto consumer goods, up 3.1%, all reversing August drops of similar magnitude. Capital goods and "other" goods grew modestly, while auto vehicles, parts and engines declined for a third consecutive month. In nominal terms, services exports increased 0.5% (+2.7 y/y), with notable gains in travel and passenger fares and modest increases in royalties and other private services. Receipts from other transportation and U.S. military sales contracts both declined somewhat.
On the import side, the September increase was the first monthly rise since March and brought nominal imports to their largest since May. Good imports were up 2.1% in nominal terms (1.8% y/y) and 1.2% in real terms (3.1% y/y), mainly in nonauto consumer goods, which were up 6.3% (4.2% y/y). Services imports fell $570MM in nominal terms, 1.5%, and were 1.5% above a year ago. The m/m decrease was distorted, however, by a huge drop in royalties and license fees of $890MM, an occasional phenomenon that last occurred in March 2010 and September 2008. Otherwise, travel and passenger fares and the like continued with moderate increases.
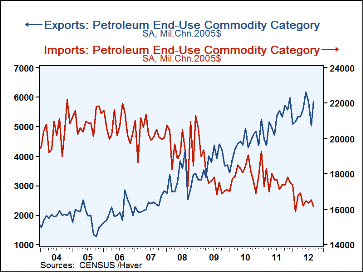
The petroleum situation is changing a bit as petroleum exports have trended higher while imports have flattened. The trade deficit in petroleum was $21.9 billion in September, a fifth consecutive month below $25 billion, and the gain in exports of industrial materials and supplies in September reflected a "real" rise in petroleum of 16.4%. In nominal terms, petroleum exports jumped a remarkable 23.8% in the month, but there is such monthly volatility that the year-on-year increase is "only" 12.1%. Petroleum imports, by contrast, are generally drifting lower. In nominal terms, August and September were both up, by 5.2% and 1.0%, respectively, but in real terms, the August rise was a mere 1.0% and in September, these declined 2.3%. The year-on-year movement shows the downtrend as nominal petroleum imports are down 9.3% and 7.1% in real terms. U.S. businesses and consumers are really using less oil.
By country, the September goods trade deficit with mainland China widened slightly m/m to $29.1B. Exports to China are up 5.0% y/y and U.S. imports are up 3.9% y/y. With Japan, the deficit was shrank markedly in September to $4.8 billion, the smallest since $4.0 billion in June 2011. U.S. exports rose 13.1% y/y as U.S. imports slowed to just 1.2% y/y. The deficit with the European Union improved sharply to $8.6B from August's wide $11.7B; U.S. exports there were down 8.0% y/y, but imports slowed to a 1.6% increase y/y following August's 5.5% y/y rise.
The international trade data can be found in Haver's USECON database. Detailed figures are available in the USINT database. The expectations figures are from the Action Economics consensus survey, which is carried in the AS1REPNA.
| Foreign Trade | ||||||||
|---|---|---|---|---|---|---|---|---|
| Sep '12 | Aug '12 | Jul '12 | Y/Y % | 2011 | 2010 | 2009 | ||
| U.S. Trade Deficit | $41.5B | $43.8B | $42.5B | $44.5B (9/11) |
$559.9B | $494.7B | $381.3B | |
| Exports (%) | 3.1 | -1.0 | -1.1 | 3.5 | 14.2 | 16.7 | -14.5 | |
| Imports | 1.5 | -0.2 | -0.6 | 1.5 | 13.9 | 19.5 | -23.0 | |
| Petroleum | 1.0 | 5.2 | -6.0 | -9.3 | 30.7 | 32.5 | -44.0 | |
| Nonpetroleum goods | 2.3 | -1.7 | 0.2 | 4.5 | 12.1 | 20.8 | -20.9 | |
Carol Stone, CBE
AuthorMore in Author Profile »Carol Stone, CBE came to Haver Analytics in 2003 following more than 35 years as a financial market economist at major Wall Street financial institutions, most especially Merrill Lynch and Nomura Securities. She had broad experience in analysis and forecasting of flow-of-funds accounts, the federal budget and Federal Reserve operations. At Nomura Securities, among other duties, she developed various indicator forecasting tools and edited a daily global publication produced in London and New York for readers in Tokyo. At Haver Analytics, Carol was a member of the Research Department, aiding database managers with research and documentation efforts, as well as posting commentary on select economic reports. In addition, she conducted Ways-of-the-World, a blog on economic issues for an Episcopal-Church-affiliated website, The Geranium Farm. During her career, Carol served as an officer of the Money Marketeers and the Downtown Economists Club. She had a PhD from NYU's Stern School of Business. She lived in Brooklyn, New York, and had a weekend home on Long Island.
More Economy in Brief
 Global| Feb 05 2026
Charts of the Week: Balanced Policy, Resilient Data and AI Narratives
by:Andrew Cates


