 Global| Aug 04 2017
U.S. Trade Deficit Narrows Yet Again
Summary
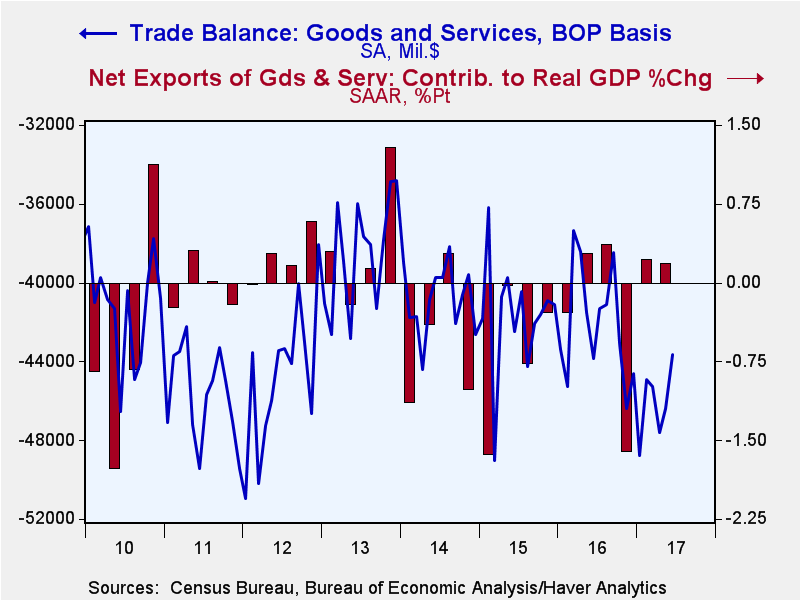
The U.S. trade deficit in goods and services was $43.6 billion in June after May's $46.4 billion; that earlier figure was revised from $46.5 billion and compares to $43.8 billion in June 2016. The Action Economics Forecast Survey [...]
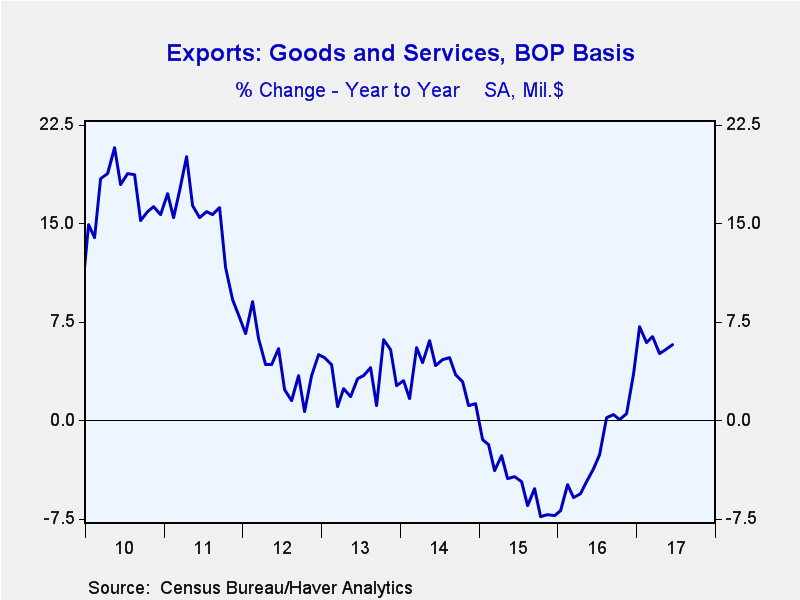
The U.S. trade deficit in goods and services was $43.6 billion in June after May's $46.4 billion; that earlier figure was revised from $46.5 billion and compares to $43.8 billion in June 2016. The Action Economics Forecast Survey showed expectations for a smaller improvement to $45.5 billion this June. Total exports advanced 1.2% (+5.8% y/y) after a 0.4% rise in May. Imports were 0.2% lower (+4.6% y/y) in June after edging down 0.1% in May.
Exports of goods rose 1.5% in June (+6.9% y/y), after increasing 0.1% in May. Gains came in most end-use categories, especially food, feed & beverages 5.9% (9.9% y/y), "other" 3.9% (3.3% y/y) and autos 2.9% (10.0% y/y). Only nonauto consumer goods fell, those by 1.9% (+2.1% y/y).
Services exports rose 1.0% (+3.9% y/y). For categories ranked by dollar amount, travel by foreign tourists in the U.S., $18.3 billion in June, increased 1.8% (+7.6% y/y) and revenue from business services, $11.9 billion, was unchanged (+0.5% y/y), while charges for the use of intellectual property, $10.2 billion, eased 0.2% (-2.4% y/y).
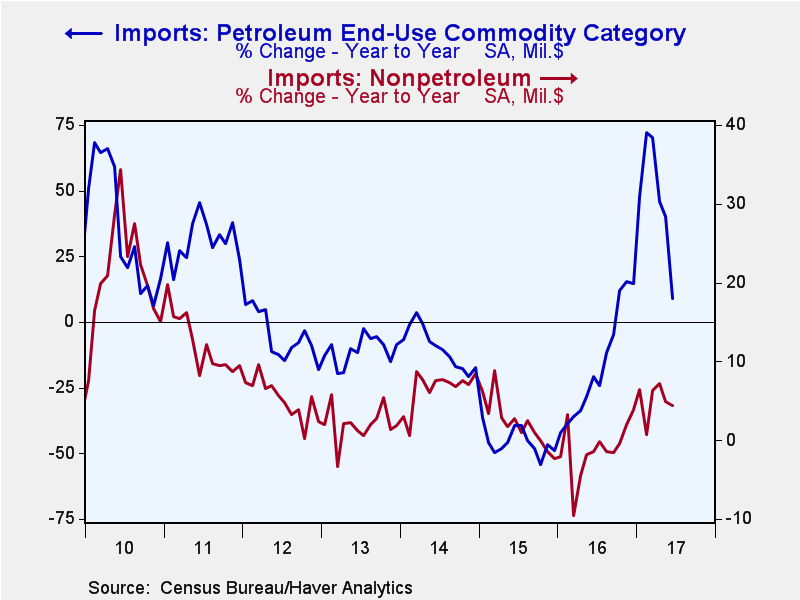
On the import side, purchases of goods edged lower 0.2% in June (+4.7% y/y). The decline came in petroleum, which dropped 10.2% (+9.1% y/y), after May's 2.2% increase. The June move resulted as the price of crude petroleum decreased to $44.68/barrel in June from $45.03 in May but was up from $39.38 in June 2016. The quantity of energy-related petroleum product imports actually fell 1.9% from a year ago, while the quantity of crude petroleum imports was up 1.9% from a year ago.
Nonpetroleum goods imports rose 0.7% (4.4% y/y), following May's 0.6% reduction. Among those imports, autos rose 3.5% (5.5% y/y), reversing their May decrease of 2.4%. "Other" goods also rose 3.5% (10.4% y/y) after a 2.9% rise in May. In contrast, nonauto consumer goods fell 1.5% (-1.9% y/y), following May's decline of 2.9%. Foods, feeds & beverages were up 0.6% (+8.3% y/y) and capital goods edged 0.2% higher (8.0% y/y).
Services imports were unchanged in June (+5.3% y/y). Travel, also the largest category of service imports, at $10.9 billion, decreased 0.2% (+7.2% y/y). Transport service imports, $8.4 billion, fell 0.5% (4.6% y/y) and business services imports, $8.1 billion, edged lower by 0.1% (-2.4% y/y). Intellectual property revenues, $4.0 billion, rose 1.0% (14.1% y/y).
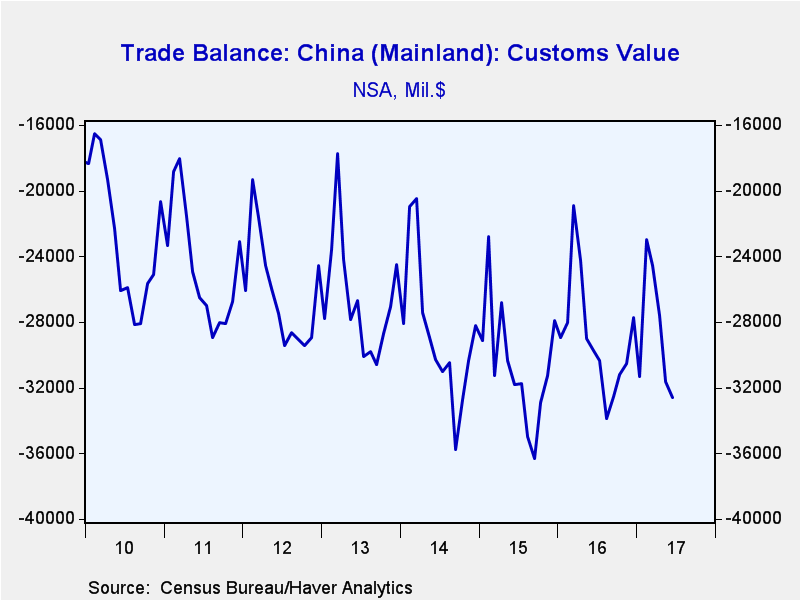
By country, the trade deficit with China widened to $32.6 billion from $29.7 billion in June 2016. Exports to China were up 9.9% y/y while imports from there rose 9.7% y/y. The trade deficit with the European Union was $12.5 billion in June, just marginally different from $12.8 billion a year earlier. Exports to the EU fell 0.4% while imports fell 1.3% y/y. The trade deficit with Japan widened to $5.6 billion versus $5.9 billion twelve months earlier. Exports to Japan rose 8.4% y/y and imports were up 1.2% y/y. These country data are not seasonally adjusted.
The international trade data can be found in Haver's USECON database. Detailed figures are available in the USINT database. The expectations figures are from the Action Economics Forecast Survey, which is carried in AS1REPNA.
| Foreign Trade in Goods & Services (Current Dollars) | Jun | May | Apr | Y/Y | 2016 | 2015 | 2014 |
|---|---|---|---|---|---|---|---|
| U.S. Trade Deficit | $43.6 bil. | $46.4 bil. | $47.6 bil. | $43.8 bil. (6/16) |
$504.8 bil. | $500.4 bil. | $490.3 bil. |
| Exports of Goods & Services (% Chg) | 1.2 | 0.4 | -0.1 | 5.8 | -2.5 | -4.7 | 3.6 |
| Imports of Goods & Services (% Chg) | -0.2 | -0.1 | 0.9 | 4.6 | -1.9 | -3.6 | 4.0 |
| Petroleum (% Chg) | -10.2 | 2.2 | -12.0 | 9.1 | -19.4 | -45.5 | -9.7 |
| Nonpetroleum Goods (% Chg) | 0.7 | -0.6 | 2.3 | 4.4 | -1.2 | 2.2 | 6.5 |
Carol Stone, CBE
AuthorMore in Author Profile »Carol Stone, CBE came to Haver Analytics in 2003 following more than 35 years as a financial market economist at major Wall Street financial institutions, most especially Merrill Lynch and Nomura Securities. She had broad experience in analysis and forecasting of flow-of-funds accounts, the federal budget and Federal Reserve operations. At Nomura Securities, among other duties, she developed various indicator forecasting tools and edited a daily global publication produced in London and New York for readers in Tokyo. At Haver Analytics, Carol was a member of the Research Department, aiding database managers with research and documentation efforts, as well as posting commentary on select economic reports. In addition, she conducted Ways-of-the-World, a blog on economic issues for an Episcopal-Church-affiliated website, The Geranium Farm. During her career, Carol served as an officer of the Money Marketeers and the Downtown Economists Club. She had a PhD from NYU's Stern School of Business. She lived in Brooklyn, New York, and had a weekend home on Long Island.
More Economy in Brief
 Global| Feb 05 2026
Charts of the Week: Balanced Policy, Resilient Data and AI Narratives
by:Andrew Cates


