 Global| Mar 21 2014
U.S. Unemployment Rates Diminish by Age and Gender
by:Tom Moeller
|in:Economy in Brief
Summary
Reported early this month, the overall civilian unemployment rate during February was 6.7%, down from the high of 9.6% reached during all of 2010. Improvement extends across all age brackets. The youngest age brackets continue, [...]
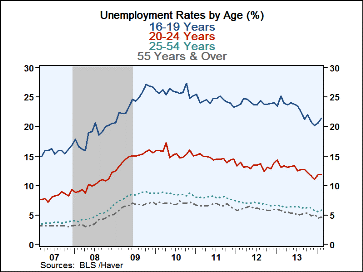
Reported early this month, the overall civilian unemployment rate during February was 6.7%, down from the high of 9.6% reached during all of 2010. Improvement extends across all age brackets. The youngest age brackets continue, however, to realize relatively high rates of joblessness. Amongst teenagers the jobless rate of 21.4%, though it's down from the recession peak of 25.9%, is more-than three times the 5.8% rate for those aged 25-54 years old. For young adults aged 20-24 who are perhaps just entering the workforce, the jobless rate of 11.9% is still twice that for the next oldest age group. For individuals aged 55 and over, the latest unemployment rate of 4.6% was the lowest of the age brackets.
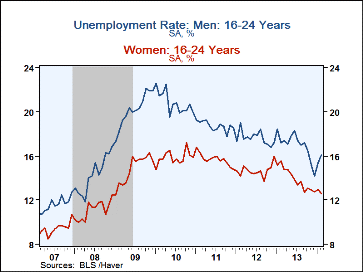
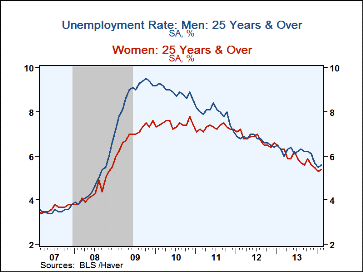
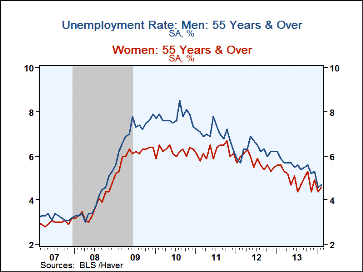
Groupings by male and female show interesting differences from these totals. As might be expected, the youngest age groups show a higher rate of joblessness amongst men (16.1%) versus women (12.6%). Both sexes show decline from the high but the gender gap narrows as time passes. For prime-age wage earners, the story is slightly different. Males' unemployment rate declined last month from a higher peak level (9.3%) than for women (7.8%). Last month, however, unemployment for men and for women was roughly equal near 5.8%. This continues a general pattern in place since the 1980s, where male and female unemployment rates are roughly equal during economic growth periods. For men and women aged 55 or older, it's the same story with the jobless rate recently falling to 4.7%.
These detailed unemployment rates are available in Haver's EMPL database.
| Unemployment Rate (%) | Unemployment Rate - Current | Unemployment Rate - 2010 | Current Unemployment Rate - Men | Current Unemployment Rate - Women |
|---|---|---|---|---|
| Total | 6.7 | 9.6 | 7.0 | 6.4 |
| 16-19 Years | 21.4 | 25.9 | 24.3 | 18.7 |
| 20-24 Years | 11.9 | 15.5 | 13.4 | 10.3 |
| 25-54 Years | 5.8 | 8.6 | 5.8 | 5.7 |
| 55 + Years | 4.6 | 7.0 | 4.7 | 4.6 |
Tom Moeller
AuthorMore in Author Profile »Prior to joining Haver Analytics in 2000, Mr. Moeller worked as the Economist at Chancellor Capital Management from 1985 to 1999. There, he developed comprehensive economic forecasts and interpreted economic data for equity and fixed income portfolio managers. Also at Chancellor, Mr. Moeller worked as an equity analyst and was responsible for researching and rating companies in the economically sensitive automobile and housing industries for investment in Chancellor’s equity portfolio. Prior to joining Chancellor, Mr. Moeller was an Economist at Citibank from 1979 to 1984. He also analyzed pricing behavior in the metals industry for the Council on Wage and Price Stability in Washington, D.C. In 1999, Mr. Moeller received the award for most accurate forecast from the Forecasters' Club of New York. From 1990 to 1992 he was President of the New York Association for Business Economists. Mr. Moeller earned an M.B.A. in Finance from Fordham University, where he graduated in 1987. He holds a Bachelor of Arts in Economics from George Washington University.
More Economy in Brief
 Global| Feb 05 2026
Charts of the Week: Balanced Policy, Resilient Data and AI Narratives
by:Andrew Cates


