 Global| Jul 28 2008
UK Real Estate Agents Report Declines In House Prices And More Difficulties In Making A Sale
Summary
The United Kingdom's Hometrack Survey reports local market information compiled by real estate agents around England and Wales. The agents report on house prices, the ratio of the sales price to the asking price, the number of weeks [...]

The United Kingdom's Hometrack Survey reports local market information compiled by real estate agents around England and Wales. The agents report on house prices, the ratio of the sales price to the asking price, the number of weeks it takes to make a sale and the average number of viewings per sale.
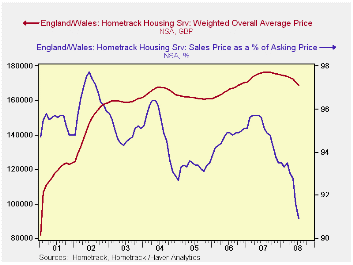
According to the July report, released today, the weighted
average price of a house fell 1.2% from 170,500 GBP (Great Britain
Pound) in June to 168,500 GBP in July. (In U. S. dollars, $335,000).
The average price of a house is now 4.4% below the peak reached a year
ago. The selling price of a house has also declined relative to its
asking price. In July, the ratio of sales price to asking price was
90.9, down from 91.6 in June and well below the recent high of 95.7
reached in May, 2007. The average price of a house and the ratio of the
sales price to the asking price are shown in the first chart.
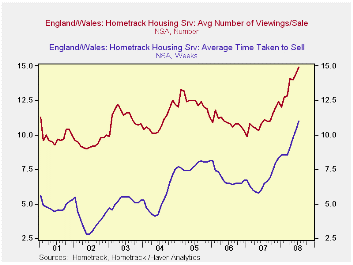
Indicative of the difficulty of selling houses, the real estate agents reported that it took 11 weeks to complete a sale in July, 2008 compared with 10.3 in June and 90% higher than the 5.8 weeks in May, 2007. The number of viewings before a sale was made was 14.9 in July up from 14.4 in June and 51% higher than the 9.9 in January, 2007. The number of weeks it takes to make a sale and the number of viewings before a sale is made are shown in the second chart.
| United Kingdom | Jul 08 | Jun 08 | Previous High or Low | Date | M/M chg | Chg from Previous High or Low | 2007 | 2006 |
|---|---|---|---|---|---|---|---|---|
| House Price (GBP) | 168500 | 170500 | 176300 | Aug 07 | -1.2% | -4.4% | 174867 | 165725 |
| Ratio Sales Price to Asking Price | 90.9 | 91.6 | 65.7 | May 07 | -0.7 | -4.8 | 95.0 | 94.7 |
| Number of Weeks before a Sale | 11.0 | 10.3 | 5.8 | May 07 | 6.8% | 89.7% | 6.7 | 6.8 |
| Number of Viewings before a Sale | 14.9 | 14.4 | 9.9 | Jan 07 | 3.5% | 50.5% | 11.0 | 10.9 |
More Economy in Brief
 Global| Feb 05 2026
Charts of the Week: Balanced Policy, Resilient Data and AI Narratives
by:Andrew Cates


