 Global| Apr 20 2007
UK Retail Sales Rise 0.3% in March, Following Upward Revision to February; Food Group Pushes Price Deflator Higher
Summary
UK retail sales rose 0.3% in volume in March, according to ONS data reported today. This followed a 1.6% jump in February, revised from 1.4% reported initially and more than recouping a 1.5% drop in January. At least one forecast [...]

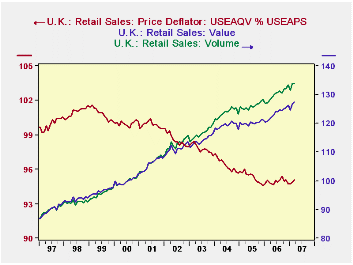
UK retail sales rose 0.3% in volume in March, according to ONS data reported today. This followed a 1.6% jump in February, revised from 1.4% reported initially and more than recouping a 1.5% drop in January. At least one forecast survey had called for volume to rise 0.5%, so some interpreted the 0.3% outcome as "below expectations". But the 0.2% upward revision to February puts sales at the level where forecasters would have seen them. The value of sales rose 0.6% in the month, indicating that prices increased 0.3%. This one month's increase in prices accounts for the entire price increase over the last year.
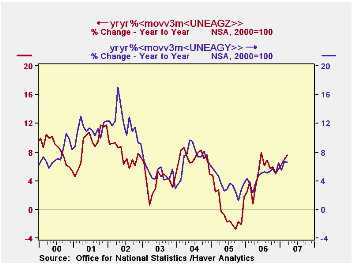
Among store types, sizable year/year volume gains are evident in clothing and in household goods outlets. During the first quarter of the year, household goods sales were up 7.5% from a year ago and clothing store sales 6.6%. [Notice that in this graph, we have made a 3-month moving average and taken the year-on-year % change, illustrating the "nested function" feature of the new DLXVG3 version we are now "beta-testing" internally.]
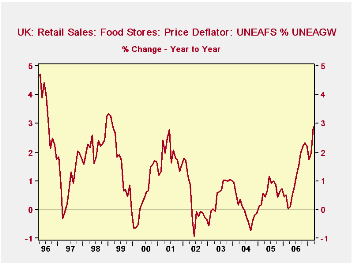
A quick calculation of the price deflators for each major store group shows that it's food store prices where the upturn has occurred. As seen in the third graph, this deflator is up 2.9% from a year ago, extending a trend that began last June. Prices in other sectors remain relatively calm.
These data, from 5,000 UK retailers, measure an average week's sales during March. In addition to standard seasonal adjustment, the ONS makes a specific adjustment for the date of Easter, which was April 8 this year, earlier than last year and therefore judged to inflate March sales more. Their press release explains that adjusting for this calendar difference reduced the seasonally adjusted March total by 0.3%. These retail sales data, unlike those for the US, do not include motor vehicle dealers or gasoline stations. Internet sales are included in "nonstore retailers" for companies that sell exclusively on the Internet, and in the respective category for Internet operations of conventional stores.
| UK Retail Sales, 2000=100* | Mar 2007 | Feb 2007 | Jan 2007 | Mar 2006 | 2006 | 2005 | 2004 |
|---|---|---|---|---|---|---|---|
| Total Volume | 134.0 | 133.6 | 131.5 | 127.9 | 129.4 | 125.3 | 122.9 |
| % Change | 0.3 | 1.6 | -1.5 | 5.4 | 3.3 | 2.0 | 6.0 |
| Total Value | 127.4 | 126.7 | 124.6 | 121.3 | 122.8 | 119.4 | 118.3 |
| % Change | 0.6 | 1.7 | -1.5 | 5.8 | 2.8 | 0.9 | 4.4 |
| Implicit Price Deflator** | 95.1 | 94.8 | 94.8 | 94.8 | 94.9 | 95.3 | 96.3 |
| % Change | 0.3 | 0.1 | 0.0 | 0.3 | -0.4 | -1.1 | -1.5 |
Carol Stone, CBE
AuthorMore in Author Profile »Carol Stone, CBE came to Haver Analytics in 2003 following more than 35 years as a financial market economist at major Wall Street financial institutions, most especially Merrill Lynch and Nomura Securities. She has broad experience in analysis and forecasting of flow-of-funds accounts, the federal budget and Federal Reserve operations. At Nomura Securites, among other duties, she developed various indicator forecasting tools and edited a daily global publication produced in London and New York for readers in Tokyo. At Haver Analytics, Carol is a member of the Research Department, aiding database managers with research and documentation efforts, as well as posting commentary on select economic reports. In addition, she conducts Ways-of-the-World, a blog on economic issues for an Episcopal-Church-affiliated website, The Geranium Farm. During her career, Carol served as an officer of the Money Marketeers and the Downtown Economists Club. She has a PhD from NYU's Stern School of Business. She lives in Brooklyn, New York, and has a weekend home on Long Island.


