 Global| Dec 17 2007
UK Rightmove House Price Index Has Biggest Month to Month Decline since Beginning of Series
Summary
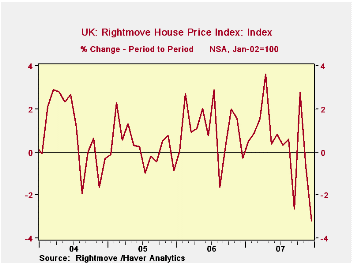
Another indicator of trouble in the U.K.'s housing market, the Rightmove House Price Index, fell 3.2% in December, the largest month to month decline since its inception in January, 2002, as can be seen in the first chart. This index [...]


Another indicator of trouble in the U.K.'s housing market, the Rightmove House Price Index, fell 3.2% in December, the largest month to month decline since its inception in January, 2002, as can be seen in the first chart. This index is based on the asking prices of properties coming to market at Rightmove Co.'s more than 11,500 estate agency branches. It is based on actual prices and actual properties rather than on surveys of opinions about prices. The sample includes some 200,000 houses each month, representing about 80% of the market.
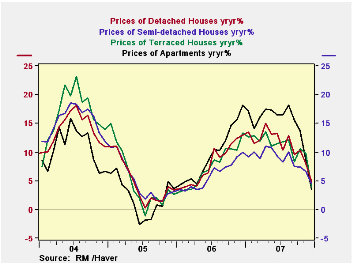
In addition to its Index, the Rightmove Co. has been publishing average prices of various types of houses--detached, semi-detached, terraced, and apartments. In December, the steepest declines took place in the terraced houses and apartments. While the prices of all types of house have declined in recent months, the prices are still above year ago levels. However, the year to year increases in the prices of all types of houses have been declining in the last half of this year, as can be seen in the second chart.
| U.K. RIGHTMOVE CO. | Dec 07 | Nov 07 | Dec 06 | M/M %Chg | Y/Y %Chg | 2007 | 2006 | 2005 |
|---|---|---|---|---|---|---|---|---|
| House Price Index (Jan 2002=100) | 189.1 | 195.3 | 180.4 | -3.17 | 4.82 | 191.2 | 172.0 | 159.4 |
| Asking Prices for Types of Houses (UK Pounds) | ||||||||
| Detached | 334039 | 339675 | 316003 | -1.66 | 5.71 | 336295 | 306255 | 284840 |
| Semi-detached | 205759 | 208794 | 196846 | -1.45 | 4.53 | 205645 | 189353 | 178630 |
| Terraced | 180224 | 187844 | 173372 | -4.06 | 3.95 | 182.661 | 164886 | 153475 |
| Apartments | 193973 | 200875 | 187434 | -3.44 | 3.49 | 196167 | 171504 | 156489 |


