 Global| Dec 21 2005
US 3Q GDP Revised Slightly Lower
by:Tom Moeller
|in:Economy in Brief
Summary
US real GDP growth for 3Q was revised down slightly to 4.1% (AR) and fell short of Consensus expectations for no change to earlier estimate of 4.3% growth. A weakened estimate of domestic demand growth caused the downward revision. [...]
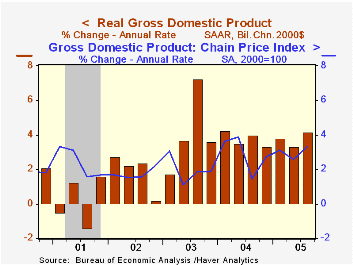
A weakened estimate of domestic demand growth caused the downward revision. Real PCE was lessened to 4.1% (3.8% y/y) from 4.3% growth and the strength in business fixed investment was lessened to 8.4% (8.3% y/y) from 8.7%. Lastly, growth in residential investment growth was dropped to 7.3% (7.2% y/y) from 8.4%.
The estimate of inventories contribution to GDP growth was unrevised at -0.4 percentage points but the drag from the foreign trade deficit was lessened as exports grew 2.5% (6.9% y/y).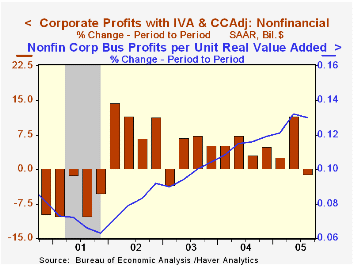
Operating corporate profits are estimated to have declined 4.0% (+15.7% y/y) versus an initial estimate of a 3.4% decline. Financial sector earnings were reduced further and fell 20.5% (+5.4% y/y), crushed by three hurricanes. Profits of domestic nonfinancial corporations also were reduced and fell 1.1% (+18.6% y/y) versus the initial estimate of a slight 0.2% gain.
Shifting Data: A Challenge for Monetary Policy Makers from the Federal Reserve Bank of San Francisco is available here.
Greenspan's Unconventional View of the Long-Run Inflation/Output Trade-off from the Federal Reserve Bank of St. Louis can be found here.
| Chained 2000$, % AR | 3Q '05 (Final) | 3Q '05 (Prelim.) | 2Q '05 | Y/Y | 2004 | 2003 | 2002 |
|---|---|---|---|---|---|---|---|
| GDP | 4.1% | 4.3% | 3.3% | 3.6% | 4.2% | 2.7% | 1.6% |
| Inventory Effect | -0.4% | -0.4% | -2.1% | -0.7% | 0.3% | 0.0% | 0.4% |
| Final Sales | 4.6% | 4.7% | 5.6% | 4.3% | 3.9% | 2.7% | 1.2% |
| Foreign Trade Effect | -0.1% | -0.3% | 1.1% | 0.2% | -0.5% | -0.3% | -0.6% |
| Domestic Final Demand | 4.5% | 4.7% | 4.2% | 4.1% | 4.4% | 3.0% | 1.8% |
| Chained GDP Price Index | 3.3% | 3.0% | 2.6% | 2.9% | 2.6% | 2.0% | 1.7% |
by Tom Moeller December 21, 2005

The Mortgage Bankers Association reported that the total number of mortgage applications dropped again last week by 4.0% following a 5.7% decline the week prior. The decline was to the lowest level in nearly a year and dropped December 3.3% below November.
Purchase applications were notably weak. A 5.2% decline followed the prior week's 3.5% drop and was to the lowest level since late October. The December average of purchase applications fell to just a 0.5% gain versus November.
During the last ten years there has been a 50% correlation between the y/y change in purchase applications and the change in new plus existing single family home sales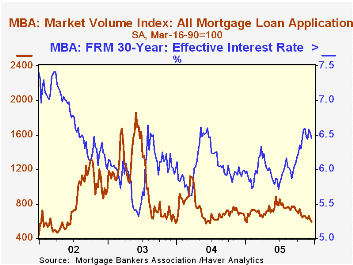
Applications to refinance fell 1.6% on top of the prior week's 9.7% slide and lowered the December average 9.6% below November.
The effective interest rate on a conventional 30-year mortgage fell again to 6.45% from 6.53% the prior week. Rates averaged 6.52% in November and averaged 5.81% in June. The effective rate on a 15-year mortgage also fell to 6.07%. The interest rates on 15 and 30 year mortgages are closely correlated (>90%) with the rate on 10 year Treasury securities.
The Mortgage Bankers Association surveys between 20 to 35 of the top lenders in the U.S. housing industry to derive its refinance, purchase and market indexes. The weekly survey accounts for more than 40% of all applications processed each week by mortgage lenders. Visit the Mortgage Bankers Association site here.
| MBA Mortgage Applications (3/16/90=100) | 12/16/05 | 12/09/05 | Y/Y | 2004 | 2003 | 2002 |
|---|---|---|---|---|---|---|
| Total Market Index | 594.6 | 619.3 | -13.7% | 735.1 | 1,067.9 | 799.7 |
| Purchase | 453.1 | 477.9 | -3.8% | 454.5 | 395.1 | 354.7 |
| Refinancing | 1,418.1 | 1,441.8 | -27.6% | 2,366.8 | 4,981.8 | 3,388.0 |
by Carol Stone December 21, 2005
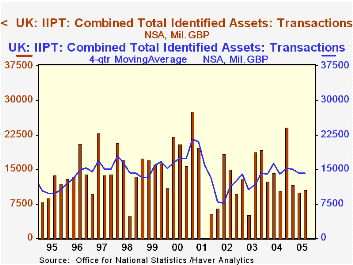
The UK Office of National Statistics today released data on institutional investors' activity in financial markets during Q3 2005.The table below gives an overview of this widely monitored information, generally known as the "MQ5" data. Today's report is the "First Release"; all the MQ5 figures are available, but the full, official release will come January 6, 2006. These data were added several months ago to Haver's "UK" database, in the Financial Data menu under "MQ5", listed at the bottom.These investors include insurance companies, pension funds, investment trusts and unit trusts, four key capital market participants.As evident just in the summary table below, the amount of detail offered is considerable, and also includes some balance sheet information and figures on asset acquisitions and liquidations as well.
One aspect of the data for the first three quarters of 2005 is that these investments so far this year look to be running below the pace of the last several years. However, we also see considerable movement among various asset categories and the accompanying graph illustrates that there is considerable volatility from quarter to quarter. So it may be that Q4 would see a more sizable flow, as happened last year. In the graph, it is seen that a four-quarter moving average of this total has been fairly steady since late 2003. 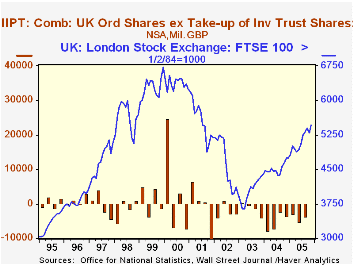
Another facet of these data is the perhaps unexpected trend of net liquidation of UK company shares. This has occurred every single quarter beginning with Q2 of 2003, more than two years ago. UK equity prices continue to rise, though, indicating that other investors are taking up the slack. Further, these institutions continue as net purchasers of other UK company securities and of foreign company securities. These developments, rather than showing some disaffection with British business, may instead serve as more evidence of the fluidity of world capital markets and the ease and ability of investors to shift their holdings.
Finally, over the last two quarters, the largest entry in our table is "Other". This includes, as noted in the footnote, loans, mortgages, land (plus property and ground rents) and several other security types, some denominated in foreign currency. More concretely, these include overseas loans and mortgages, direct investment interests and balances of overseas branches. All of these items, as in the prior interpretation of flows among various corporate securities, point to the increasing globalization of capital markets. These firms' portfolio and direct investments abroad are increasing, and moreover, they are putting incremental funds in new and different categories, both domestic and foreign, not simply government bonds, in which their flows remain quite modest.
| UK: Net Investment by Institutional Investors (Millions of Pounds Sterling) |
Q3 2005 | Q2 2005 | Q1 2005 | Quarterly Average|||
|---|---|---|---|---|---|---|
| 2004 | 2003 | 2002 | ||||
| Total Identified Assets | 10.7 | 10.1 | 11.8 | 15.2 | 14.0 | 12.4 |
| Short-Term Assets | 1.0 | 7.3 | 1.2 | 3.1 | 0.2 | -1.8 |
| British Govt Sterling Securities | 3.7 | -5.1 | 4.4 | 4.2 | 5.0 | 1.5 |
| UK Company Shares | -3.7 | -5.1 | -2.9 | -5.2 | -1.3 | -3.1 |
| Other UK Company Securities | 0.2 | 0.7 | 3.7 | 5.1 | 6.4 | 6.7 |
| Overseas Company Shares | 3.9 | 5.0 | -0.7 | 3.6 | 0.9 | 5.5 |
| Other Overseas Company Securities | -1.4 | 1.3 | 1.7 | 2.4 | 1.7 | 1.7 |
| Overseas Govt Securities | -0.4 | 0.4 | 0.6 | -1.0 | -0.9 | -0.3 |
| All Other Assets* | 7.4 | 5.6 | 3.7 | 3.1 | 2.0 | 1.2 |
Tom Moeller
AuthorMore in Author Profile »Prior to joining Haver Analytics in 2000, Mr. Moeller worked as the Economist at Chancellor Capital Management from 1985 to 1999. There, he developed comprehensive economic forecasts and interpreted economic data for equity and fixed income portfolio managers. Also at Chancellor, Mr. Moeller worked as an equity analyst and was responsible for researching and rating companies in the economically sensitive automobile and housing industries for investment in Chancellor’s equity portfolio. Prior to joining Chancellor, Mr. Moeller was an Economist at Citibank from 1979 to 1984. He also analyzed pricing behavior in the metals industry for the Council on Wage and Price Stability in Washington, D.C. In 1999, Mr. Moeller received the award for most accurate forecast from the Forecasters' Club of New York. From 1990 to 1992 he was President of the New York Association for Business Economists. Mr. Moeller earned an M.B.A. in Finance from Fordham University, where he graduated in 1987. He holds a Bachelor of Arts in Economics from George Washington University.
More Economy in Brief
 Global| Feb 05 2026
Charts of the Week: Balanced Policy, Resilient Data and AI Narratives
by:Andrew Cates


