 Global| Jun 29 2005
US GDP & Corporate Profit Growth Revised Up
by:Tom Moeller
|in:Economy in Brief
Summary
US real GDP growth in 1Q '05 was revised up further to 3.8% (AR), in line with Consensus expectations. Corporate profit growth (w/IVA & CCA) also was revised up to 6.0% (15.4% y/y) versus the preliminary estimate of a 4.5% increase. [...]
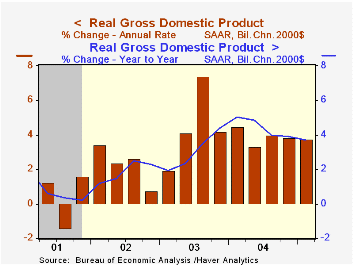
US real GDP growth in 1Q '05 was revised up further to 3.8% (AR), in line with Consensus expectations.
Corporate profit growth (w/IVA & CCA) also was revised up to 6.0% (15.4% y/y) versus the preliminary estimate of a 4.5% increase. Profitability amongst US nonfinancial corporations rose 3.4% (22.6% y/y) instead of declining 0.8% as initially estimated.
The upward revision to profits stemmed from an increase in profit margins which were initially estimated to have declined.
Growth in domestic demand growth also was revised up to 3.5% Growth in business investment was raised slightly to 4.1% (10.9% y/y) and growth in residential building was raised sharply to 11.5% (8.1% y/y). Real PCE growth was left unchanged at 3.6% (3.6% y/y).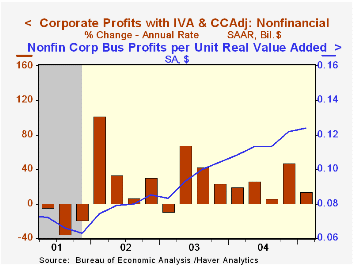
The drag on US output growth from a larger foreign trade deficit was little changed as exports grew 8.9% and imports rose 9.6% while the contribution to GDP growth from faster inventory accumulation also was little revised at 0.7%.
The chain price index was revised down to 2.9% growth as the price index for domestic demand was lowered to 2.7% (2.7% y/y).
| Chained 2000$, % AR | 1Q '05 (Final) | 1Q '05 (Prelim.) | 4Q '04 | Y/Y | 2004 | 2003 | 2002 |
|---|---|---|---|---|---|---|---|
| GDP | 3.8% | 3.5% | 3.8% | 3.7% | 4.4% | 3.0% | 1.9% |
| Inventory Effect | 0.7% | 0.8% | 0.5% | 0.2% | 0.4% | -0.1% | 0.4% |
| Final Sales | 3.0% | 2.7% | 3.4% | 3.5% | 4.0% | 3.1% | 1.4% |
| Foreign Trade Effect | -0.6% | -0.7% | -1.4% | -0.6% | -0.4% | -0.3% | -0.7% |
| Domestic Final Demand | 3.5% | 3.2% | 4.5% | 4.1% | 4.4% | 3.4% | 2.1% |
| Chained GDP Price Index | 2.9% | 3.2% | 2.3% | 2.4% | 2.2% | 1.8% | 1.7% |
by Tom Moeller June 29, 2005
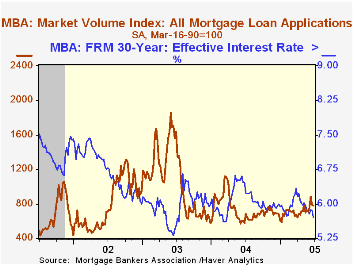
The Mortgage Bankers Association reported that total mortgage applications fell another 1.1% last week following the 11.3% decline during the week prior. As a result of increases earlier in the month, applications in June grew 9.9% versus the May average which rose 6.5% versus April.
Purchase applications slipped 0.4% adding to the 9.4% w/w drop during the prior week. In June purchase applications rose 1.3% from May which rose 3.1% from April. During the last ten years there has been a 50% correlation between the y/y change in purchase applications and the change in new plus existing single family home sales.
Applications to refinance fell 1.8% w/w but in June were 21.2% versus May.
The effective interest rate on a conventional 30-year mortgage fell sharply to 5.71%, down from the 5.92% averaged during May. It was the lowest rate since March 2004. The effective rate on a 15-year mortgage also fell sharply to 5.33%.
The Mortgage Bankers Association surveys between 20 to 35 of the top lenders in the U.S. housing industry to derive its refinance, purchase and market indexes. The weekly survey accounts for more than 40% of all applications processed each week by mortgage lenders. Visit the Mortgage Bankers Association site here.
| MBA Mortgage Applications (3/16/90=100) | 06/24/05 | 06/17/05 | Y/Y | 2004 | 2003 | 2002 |
|---|---|---|---|---|---|---|
| Total Market Index | 778.4 | 786.8 | 35.4% | 735.1 | 1,067.9 | 799.7 |
| Purchase | 477.4 | 479.4 | 9.6% | 454.5 | 395.1 | 354.7 |
| Refinancing | 2,529.2 | 2,575.0 | 82.4% | 2,366.8 | 4,981.8 | 3,388.0 |
by Carol Stone June 29, 2005
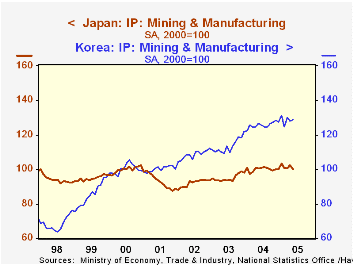
Industrial activity in Japan and Korea shows sharply varying patterns, both in recent months and over the past several years. In Japan, mining and manufacturing output in May stood at 100.1, that is, barely above the amount five years ago for this index based at 100 in 2000. Looking at these endpoints, though, masks the recession in 2001 and a recovery in 2003 and 2004. However, the evolution over the past few months has started to show renewed hesitation. An industry segment in which Japan and Korea compete actively is motor vehicles. For Japan, the corresponding production sector, transport equipment (excluding ships and rolling stock), has been relatively volatile of late, but at 116.3 in May, the sector shows growth since 2000 averaging just over 3%.
Total output in Korea has been considerably more vigorous, with the May 2005 index standing a 128.8, an average annualized gain of 5.1% since the base year in 2000. Despite this attractive average, the gains have been uneven over time and across industries. Chemicals and products have been strong fairly consistently, and radio, TV and communications equipment showed sizable increases in 2003 and 2004, but some recent hesitation. The motor vehicle sector, illustrated in the second graph along with that in Japan, has grown 9% - 10% yearly, but after a spike in December and January, has weakened markedly. These latest declines carried total vehicle production down to the lowest in seven months and to a level just equal to the average monthly output in the last two years. They are probably just an adjustment to that end-2004 surge, but may skittishness some skittishness as world energy prices stay high.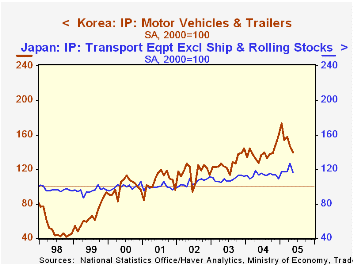
| Indexes, 2000=100, Monthly, Seasonally adjusted |
May 2005 | Apr 2005 | Mar 2005 | Year Ago (Yr/Yr % Chg) | 2004 | 2003 | 2002 |
|---|---|---|---|---|---|---|---|
| Japan: Mining & Manufacturing | 100.1 | 102.5 | 100.6 | 100.5 | 100.2 | 95.0 | 92.0 |
| % Change | -2.3 | 1.9 | -0.2 | 0.9 | 5.5 | 3.2 | -1.2 |
| Transport Equipment* | 116.3 | 126.4 | 117.7 | 113.4 | 113.5 | 108.5 | 105.2 |
| % Change | -8.0 | 7.4 | 0.3 | 5.0 | 4.6 | 3.1 | 5.9 |
| Korea: Mining & Manufacturing | 128.8 | 128.0 | 129.9 | 126.6 | 125.7 | 113.7 | 108.4 |
| % Change | 0.6 | -1.5 | 4.3 | 4.0 | 10.8 | 4.9 | 8.1 |
| Motor Vehicles | 139.8 | 146.7 | 157.4 | 127.8 | 139.1 | 127.5 | 116.7 |
| % Change | -4.7 | -6.8 | 1.9 | 9.3 | 9.1 | 9.2 | 9.9 |

Tom Moeller
AuthorMore in Author Profile »Prior to joining Haver Analytics in 2000, Mr. Moeller worked as the Economist at Chancellor Capital Management from 1985 to 1999. There, he developed comprehensive economic forecasts and interpreted economic data for equity and fixed income portfolio managers. Also at Chancellor, Mr. Moeller worked as an equity analyst and was responsible for researching and rating companies in the economically sensitive automobile and housing industries for investment in Chancellor’s equity portfolio. Prior to joining Chancellor, Mr. Moeller was an Economist at Citibank from 1979 to 1984. He also analyzed pricing behavior in the metals industry for the Council on Wage and Price Stability in Washington, D.C. In 1999, Mr. Moeller received the award for most accurate forecast from the Forecasters' Club of New York. From 1990 to 1992 he was President of the New York Association for Business Economists. Mr. Moeller earned an M.B.A. in Finance from Fordham University, where he graduated in 1987. He holds a Bachelor of Arts in Economics from George Washington University.
More Economy in Brief

 Global| Feb 05 2026
Charts of the Week: Balanced Policy, Resilient Data and AI Narratives
by:Andrew Cates

