 Global| Jan 28 2005
US GDP Growth Knocked Hard By Trade Sector Deterioration
by:Tom Moeller
|in:Economy in Brief
Summary
US real GDP last quarter rose just 3.1% (AR), the leanest rate of growth in nearly two years. Despite the weak finish to 2004, 4.4% growth for the full year was the strongest since 1999. The Consensus expectation had been for 3.5% [...]
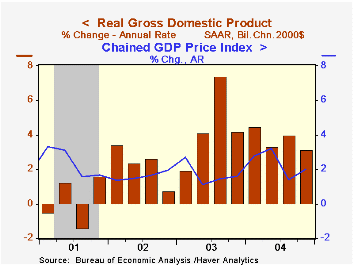
US real GDP last quarter rose just 3.1% (AR), the leanest rate of growth in nearly two years. Despite the weak finish to 2004, 4.4% growth for the full year was the strongest since 1999. The Consensus expectation had been for 3.5% growth in 4Q.
Trade sector deterioration sapped 1.73 percentage points from 4Q GDP growth, the most for any quarter since 2Q 1998 and near the record for the last twenty years. A huge 12.2% (10.7% y/y) gain in imports of goods was countered by a 6.8% decline (+4.2% y/y) in goods exports.
Domestic demand growth maintained a healthy pace at 4.3%, led by 4.6% (3.9% y/y) growth in PCE. Business fixed investment in equipment & software also rose a strong 14.9% (13.6% y/y) though investment in structures fell for the third quarter of the last four (-1.6% y/y). Residential investment was weak as well growing only 0.3% (5.7% y/y), the smallest quarterly gain in three years.
Inventory accumulation sped up and added 0.4 percentage points to growth but the contribution made up less than half of the decumulation in 3Q. For the full year, production increases to raise inventories added 0.4 percentage points to GDP growth but that was not half of the additions of the past.
Price inflation accelerated to 2.0% from 1.4% in 3Q driven by 2.7% (2.9% y/y) growth in prices behind domestic demand. The PCE chain price index rose 2.5% (2.5% y/y) and the private fixed investment price index rose 1.7% (1.2% y/y). A 5.2% (4.8% y/y) gain in prices at the state & local level raised the overall government price index 4.0% (4.2% y/y).
| Chained 2000$, % AR | 4Q '04 | 3Q '04 | Y/Y | 2004 | 2003 | 2002 |
|---|---|---|---|---|---|---|
| GDP | 3.1% | 4.0% | 3.7% | 4.4% | 3.0% | 1.9% |
| Inventory Effect | 0.4% | -1.0% | 0.3% | 0.4% | -0.1% | 0.4% |
| Final Sales | 2.7% | 5.0% | 3.4% | 4.0% | 3.1% | 1.4% |
| Trade Effect | -1.7% | -0.1% | -0.7% | -0.4% | -0.3% | -0.7% |
| Domestic Final Demand | 4.3% | 4.9% | 4.1% | 4.4% | 3.4% | 2.1% |
| Chained GDP Price Index | 2.0% | 1.4% | 2.4% | 2.1% | 1.8% | 1.7% |

Tom Moeller
AuthorMore in Author Profile »Prior to joining Haver Analytics in 2000, Mr. Moeller worked as the Economist at Chancellor Capital Management from 1985 to 1999. There, he developed comprehensive economic forecasts and interpreted economic data for equity and fixed income portfolio managers. Also at Chancellor, Mr. Moeller worked as an equity analyst and was responsible for researching and rating companies in the economically sensitive automobile and housing industries for investment in Chancellor’s equity portfolio. Prior to joining Chancellor, Mr. Moeller was an Economist at Citibank from 1979 to 1984. He also analyzed pricing behavior in the metals industry for the Council on Wage and Price Stability in Washington, D.C. In 1999, Mr. Moeller received the award for most accurate forecast from the Forecasters' Club of New York. From 1990 to 1992 he was President of the New York Association for Business Economists. Mr. Moeller earned an M.B.A. in Finance from Fordham University, where he graduated in 1987. He holds a Bachelor of Arts in Economics from George Washington University.
More Economy in Brief

 Global| Feb 05 2026
Charts of the Week: Balanced Policy, Resilient Data and AI Narratives
by:Andrew Cates

