Global| Aug 30 2007
US GDP Growth Revised Up, Profit Growth Slowed
Summary
U.S. real GDP growth during 2Q 2007 was revised higher to 4.0% (AR) from the advance report of 3.4% growth. The figure about matched consensus expectations for a 4.0 to 4.1% rise. Reported for the first time, 2Q profits (so-called [...]
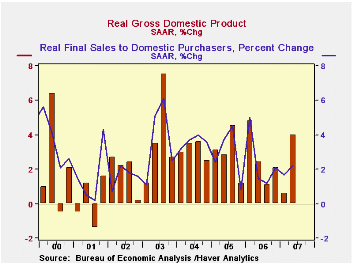
U.S. real GDP growth during 2Q 2007 was revised higher to 4.0% (AR) from the advance report of 3.4% growth. The figure about matched consensus expectations for a 4.0 to 4.1% rise.
Reported for the first time, 2Q profits (so-called operating profits, with IVA and CCAdj) advanced 6.4%; weakness in the prior three quarters means the year/year growth was just 4.5%. Profits at U.S. nonfinancial corporations grew just 3.2% and they are below Q2 2006 by 1.4%. Financial companies saw good gains, 12.1% in the quarter, producing 5.4% from a year ago. Earnings from foreign operations posted a 5.4% increase, yielding 21.1% year/year.
Growth in final sales to domestic purchasers was revised to 2.2% from 1.7% initially reported.
Growth in business fixed investment was revised higher to an 11.1% (4.1% y/y) rate, from 8.1% reported last month. Spending both on structures and on equipment & software was enlarged, structures to 27.2% from 22.1% and equipment to 4.3% from just 2.3% in last month's tally.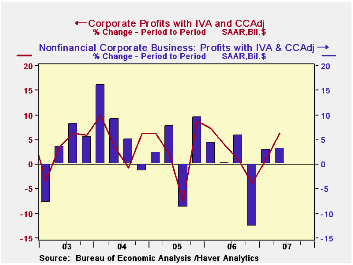
Growth in real personal consumption expenditures was changed little at 1.4% versus 1.3%. Durables spending was cut to 0.4% growth from 1.6% last month, but nondurable goods showed only a 0.1% decline compared with 0.8% down reported before. Services were also reduced, to 0.6% growth from 2.2% showing earlier.
The decline in residential investment was deepened to 11.6% from 9.3%. The year/year change is now -16.4%, virtually the same size loss as in Q1.
Real consumption and investment spending by governments grew 4.1%, down marginally from 4.2% in the previous report.Inventories added 0.2 percentage points to GDP growth, the same as shown before, while the contribution of net exports was raised to 1.4 percentage points from 1.2 percentage points indicated before and a nice turnaround from Q1's 0.5 percentage point drag. Exports grew 7.6% and imports decreased 3.2%. 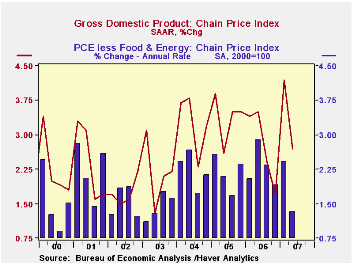
The rise in the GDP chain price index was unrevised at 2.7%, in line with the average over the last year. The domestic final sales price deflator grew 3.8% (2.5% y/y). Consumer prices less food & energy rose just 1.3% (2.0% y/y), initially reported at 1.4%.
| Chained 2000$, % AR | 2Q '07 (Prelim.) | 2Q '07 (Advance) | 1Q '07 | Y/Y | 2006 | 2005 | 2004 |
|---|---|---|---|---|---|---|---|
| GDP | 4.0 | 3.4 | 0.6 | 1.9 | 2.9 | 3.1 | 3.6 |
| Inventory Effect | 0.2 | 0.2 | -0.7 | -0.4 | 0.1 | -0.2 | 0.4 |
| Final Sales | 3.7 | 3.2 | 1.3 | 2.4 | 2.8 | 3.3 | 3.3 |
| Foreign Trade Effect | 1.4 | 1.2 | -0.5 | 0.5 | -0.1 | -0.2 | -0.7 |
| Domestic Final Demand | 2.2 | 1.9 | 1.7 | 1.8 | 2.7 | 3.3 | 3.8 |
| Chained GDP Price Index | 2.7 | 2.7 | 4.2 | 2.8 | 2.6 | 1.7 | 2.1 |
Carol Stone, CBE
AuthorMore in Author Profile »Carol Stone, CBE came to Haver Analytics in 2003 following more than 35 years as a financial market economist at major Wall Street financial institutions, most especially Merrill Lynch and Nomura Securities. She had broad experience in analysis and forecasting of flow-of-funds accounts, the federal budget and Federal Reserve operations. At Nomura Securities, among other duties, she developed various indicator forecasting tools and edited a daily global publication produced in London and New York for readers in Tokyo. At Haver Analytics, Carol was a member of the Research Department, aiding database managers with research and documentation efforts, as well as posting commentary on select economic reports. In addition, she conducted Ways-of-the-World, a blog on economic issues for an Episcopal-Church-affiliated website, The Geranium Farm. During her career, Carol served as an officer of the Money Marketeers and the Downtown Economists Club. She had a PhD from NYU's Stern School of Business. She lived in Brooklyn, New York, and had a weekend home on Long Island.
More Economy in Brief
 Global| Mar 26 2026
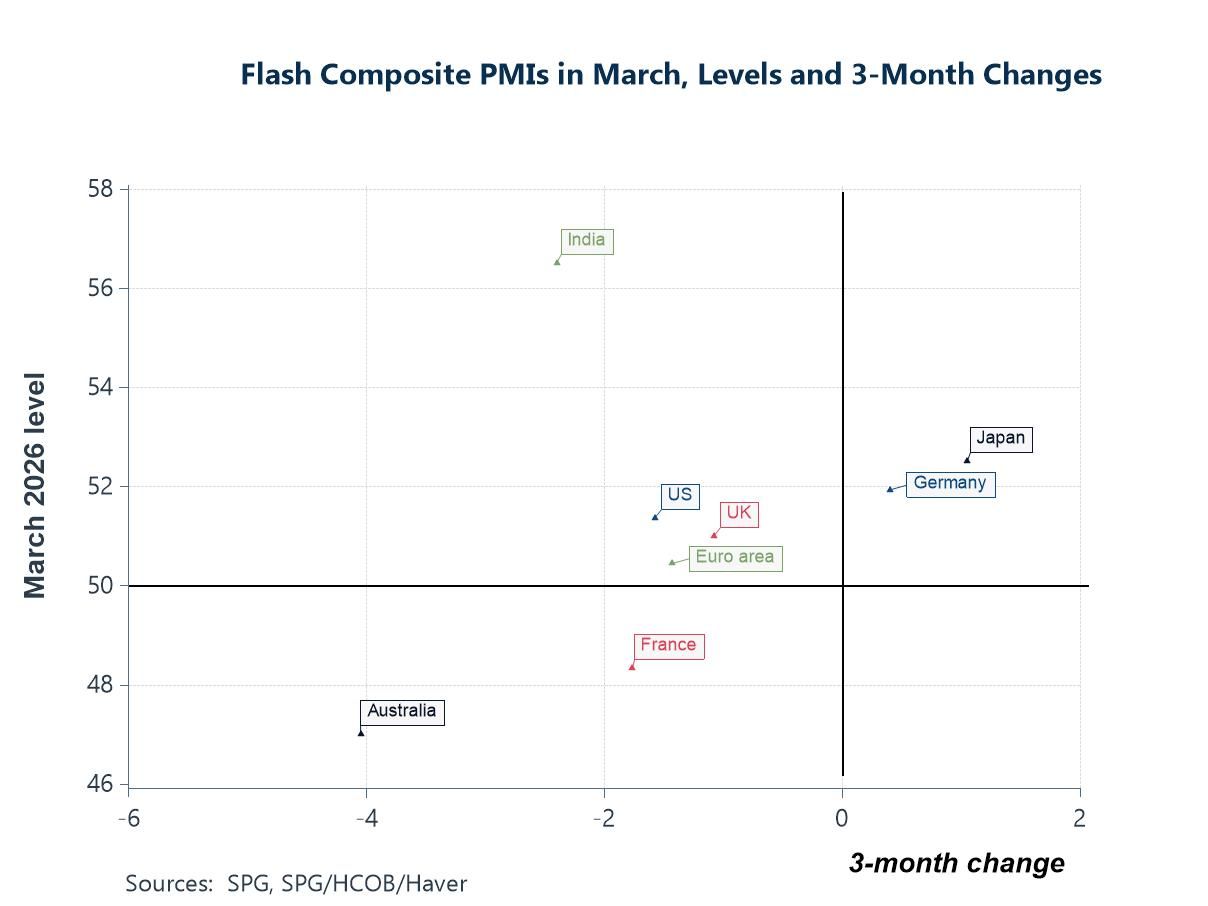
Charts of the Week: A Supply-Constrained World Comes into Sharper Focus
by:Andrew Cates