 Global| Mar 10 2006
What Is MEW? How Is It Calculated? Is It a Source of Free Money for Consumers?
Summary
Yesterday here, Tom Moeller discussed the Q4 Flow-of-Funds data and highlighted the important role of consumer borrowing during 2005. The release of this enormous body of data permits examination of other parts of consumer balance [...]
Yesterday here, Tom Moeller discussed the Q4 Flow-of-Funds data and highlighted the important role of consumer borrowing during 2005. The release of this enormous body of data permits examination of other parts of consumer balance sheets and those of other sectors of the economy.
Consumers own assets.When they spend, besides their flow of current income, consumers can use their assets to finance their spending. The simplest form of spending against assets is writing a check or using a debit card to access bank accounts. Some assets, such as stocks, can be sold to obtain spendable cash.
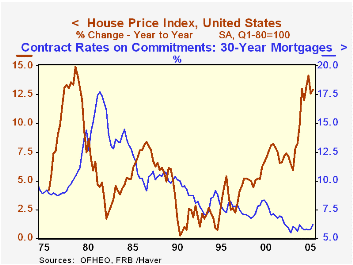
The vast majority of people own houses. In recent years, the prices of their houses have gone up dramatically. But it's impractical to sell this asset for spending money. Instead, a growing practice is that of borrowing against the value of the property. Lenders facilitate this through home equity lines of credit and quickly processed refinancing transactions. Low mortgage rates, usually tax deductible, have made such borrowing even more attractive. (See first and second graphs)
A month or so ago here, Tom Moeller also explained about one form of this borrowing, "cash-out refinancing", in which consumers refinance their home mortgage and increase the principal amount of their debt. They can then spend this "cash" they have "taken out" of their home equity. He pointed out that historically such financial actions have come at times of economic and financial stress. Increasingly, though, people are apparently also using such borrowing in a discretionary way to pay for major outlays, such as college tuition, car purchases, major vacations, and so on. This borrowing against the value of one's home is frequently called "mortgage equity withdrawal".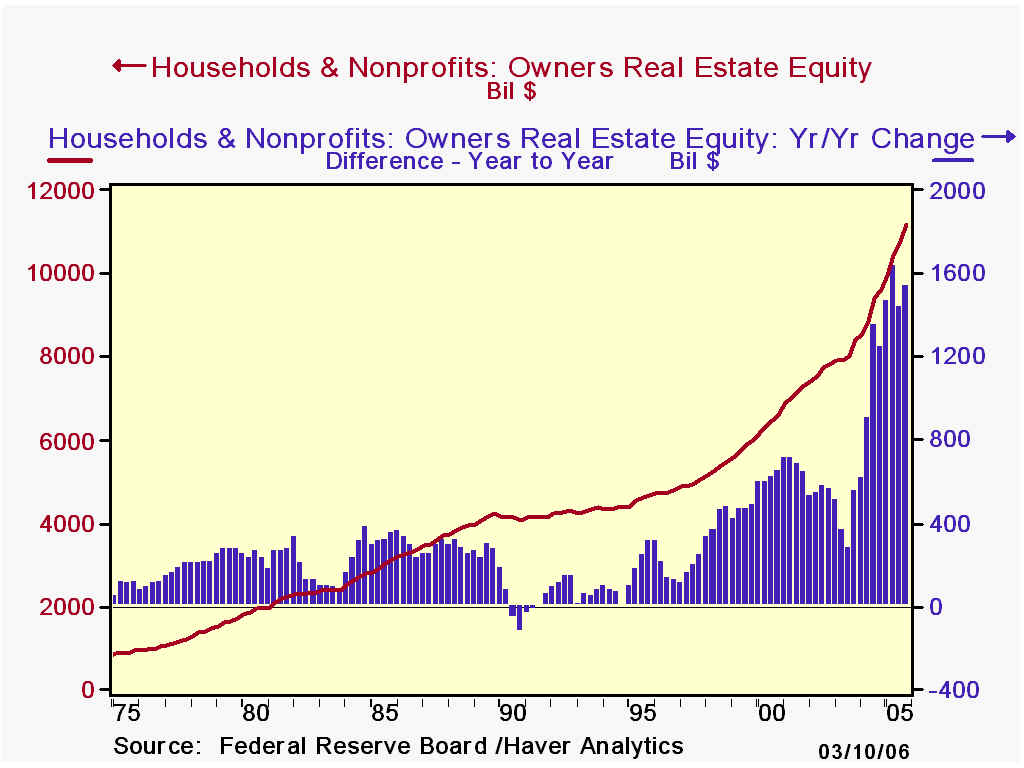
The term "mortgage equity withdrawal (MEW)" is an awkward phrase, but it's in wide use at present. It refers to the reduction of home equity by borrowing against it in the mortgage market. The first use of that term we're aware of comes from the Bank of England, which developed the concept in 2001. We prefer "home equity withdrawal" and some series compiled by Federal Reserve Board analysts use the phrase "equity extraction". Since this is a source of spending money, analysts are anxious to calculate it to gauge any possible impact on consumer spending.
An important technicality arises. Some mortgage borrowing has the purpose of creating the housing asset in the first place. So total net new mortgage debt alone overstates the amount of funds available for consumer spending on ordinary goods and services. But published mortgage data are not clearly classified by details of use. So analysts must compile estimates of these amounts. The assumptions in the calculations can make MEW vary considerably.
In Haver's USECON database, we have recently added five series of "Mortgage Equity Withdrawal". Two were devised by Alan Greenspan and James Kennedy of the Federal Reserve Board as part of an attempt to refine existing aggregate data on home mortgage originations and repayments. They compute the amount of borrowing that would be required to finance home purchases at lenders' average loan-to-value ratios. For a detailed explanation see FEDS working paper 2005-41, "Estimates of Home Mortgage Originations, Repayments, and Debt on One-to-Four-Family Residences" by Alan Greenspan and James Kennedy. We call these MEW4 and MEW5. The latter nets out closing costs on mortgage transactions. In this case and in another by economists at a leading investment bank, the value of new home sales is obtained by a simple multiplication of the number of sales by average prices. The Wall-Street devised measure is Haver's series MEW2. The Fed analysts also estimate the number of sales likely to be all-cash and net them out. The remaining value is multiplied by lenders' average loan-to-value ratios to obtain the applicable amount of the mortgage loan that goes toward the house itself. Equity withdrawal is then total mortgage borrowing less the debt dedicated directly to the house. This remainder can be negative, indicating a net infusion of equity by the homeowner.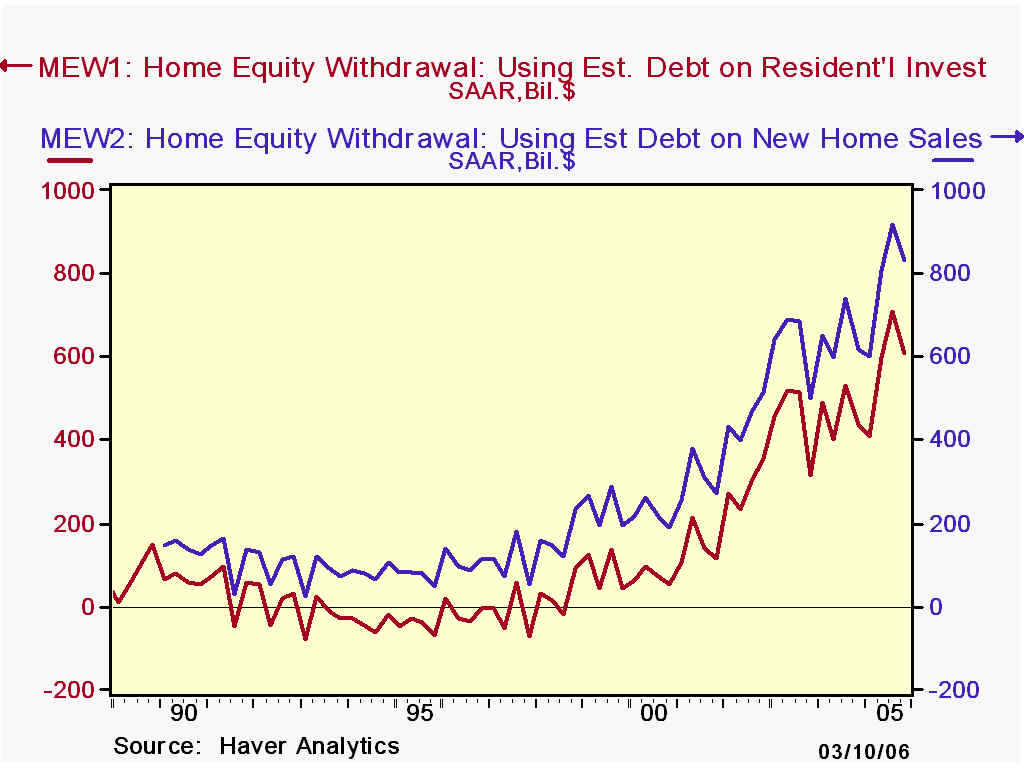
We believe the new-home-sales-based measures are not broad enough, however, to capture all of the initial property value. It's possible, in our view, that those versions of MEW understate the house-dedicated debt and overstate the amount available for consumer spending. New home sales are only a portion of new home construction; compare their number, 1.283 million in 2005, to single-family housing starts, 1.716 million. Further, homeowners can also borrow to remodel their existing home, and this borrowing adds value to their property. Indeed, "residential improvements" are not part of PCE, but are classified in "residential investment"; last year they totaled $158 billion, equal to about 37% of the investment in new single-family homes.
So we have calculated two simple, but more comprehensive measures. The simplest of all, our MEW3, is just home mortgage borrowing less the value of residential construction put-in-place. Since lenders would not lend the full value of the home construction, this subtracts too much from mortgage borrowing, and this measure of MEW is too low. But it can serve as a "quick and dirty" baseline approximation. MEW can be at least as large as this measure. Our series of choice, MEW1, is a variant of this construction-value approach; we use the value of residential investment by households [a few residential properties are owned by corporations and other organizations], a national income accounts series published in the Flow of Funds, Tables F.6 and F.100. We apply a loan-to-value ratio to that amount and subtract it from net new home mortgage borrowing.
In Q4, home mortgage borrowing was $1,110.5 billion (SAAR), down from $1,205.1 billion in Q3. Residential investment by households was $672.1 billion, up from Q3's $656.5 billion. At a 74.6% loan-to-value ratio, the implied borrowing on the construction amount is $501.6, leaving $608.9 billion of the mortgage borrowing available to be spent on other things, that is, a "cash-out" or "withdrawal" of equity, our series MEW1. Often this figure is compared to disposable income, and it was 6.6% of Q4 DPI. By this reckoning, the highest such ratio was 7.9%, just in Q3.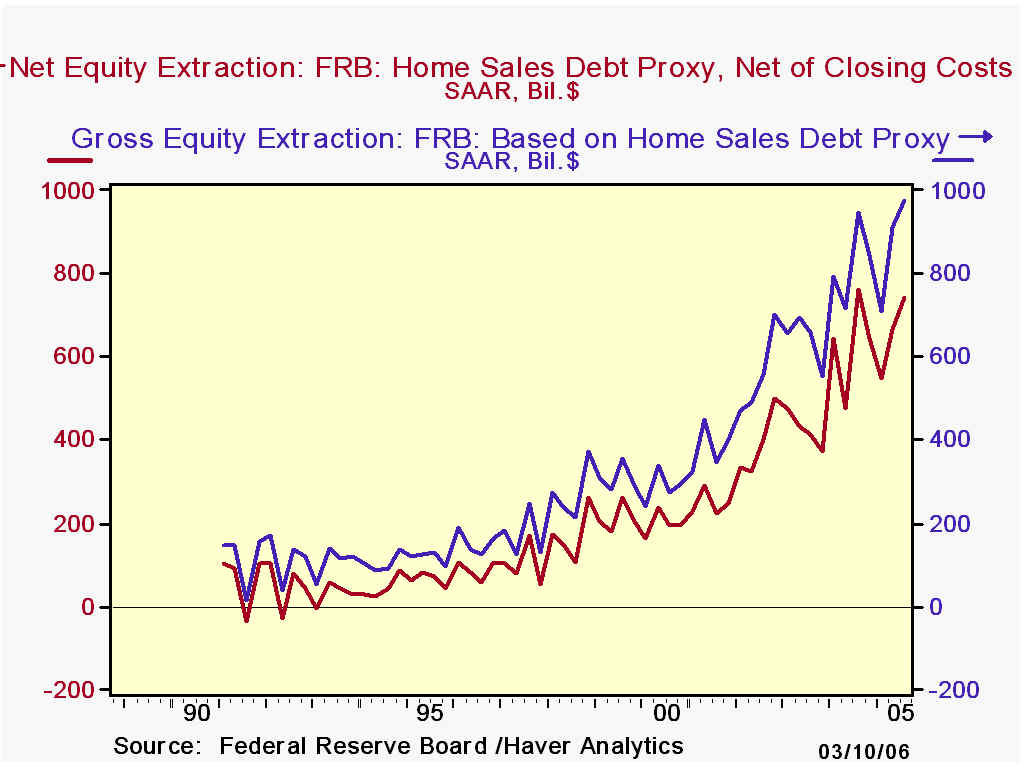
The new-home-sales based method, MEW2, yields a MEW value of $831.5 billion in Q4, down from $916.4 billion in Q3. The corresponding ratio to disposable income fell to 9.0% from 10.1%. The Federal Reserve's working paper series (which are NOT "official" statistical release data) will be reported for Q4 sometime over the next couple of weeks.
There is significant controversy presently over how much MEW might have spurred consumer spending the last couple of years. We do not take a stand in this debate, but try to provide you with some resources you can use to interpret others' arguments or in fact draw your own conclusions. What is evident from our analysis is that the mortgage market has never been anywhere near as significant as it was during 2005 in providing funds to consumer borrowers beyond those needed for home construction. So we are in uncharted waters as we move forward with interest rates on the way up and the housing market showing signs of slowing down. Since these funds are consumer liabilities that carry an interest cost, regardless of how the funds have been used, and people's homes are pledged as collateral, we'd see the heavy borrowing as a source of noteworthy vulnerability.
| SAAR, Bil.$ | Q4 2005 | Q3 2005 | Q2 2005 | Q1 2005 | 2005 | 2004 | 2000 | 1990 |
|---|---|---|---|---|---|---|---|---|
| MEW1* | 608.9 | 709.4 | 595.4 | 407.5 | 580.3 | 463.7 | 70.3 | -46.1 |
| % of DPI | 6.6 | 7.9 | 6.6 | 4.6 | 6.4 | 5.4 | 1.0 | -0.9 |
| MEW2** | 831.5 | 916.4 | 803.9 | 601.0 | 788.2 | 651.1 | 220.1 | 71.2 |
| % of DPI | 9.0 | 10.1 | 9.0 | 6.8 | 8.7 | 7.5 | 3.1 | 1.3 |
| MEW5** | -- | 744.4 | 664.7 | 550.4 | -- | 632.6 | 198.9 | 64.0 |
| % of DPI | -- | 8.2 | 7.4 | 6.2 | -- | 7.3 | 2.8 | 1.2 |
Carol Stone, CBE
AuthorMore in Author Profile »Carol Stone, CBE came to Haver Analytics in 2003 following more than 35 years as a financial market economist at major Wall Street financial institutions, most especially Merrill Lynch and Nomura Securities. She had broad experience in analysis and forecasting of flow-of-funds accounts, the federal budget and Federal Reserve operations. At Nomura Securities, among other duties, she developed various indicator forecasting tools and edited a daily global publication produced in London and New York for readers in Tokyo. At Haver Analytics, Carol was a member of the Research Department, aiding database managers with research and documentation efforts, as well as posting commentary on select economic reports. In addition, she conducted Ways-of-the-World, a blog on economic issues for an Episcopal-Church-affiliated website, The Geranium Farm. During her career, Carol served as an officer of the Money Marketeers and the Downtown Economists Club. She had a PhD from NYU's Stern School of Business. She lived in Brooklyn, New York, and had a weekend home on Long Island.
More Economy in Brief

 Global| Feb 05 2026
Charts of the Week: Balanced Policy, Resilient Data and AI Narratives
by:Andrew Cates

