 Global| Aug 03 2010
Wheat Prices In Perspective
Summary
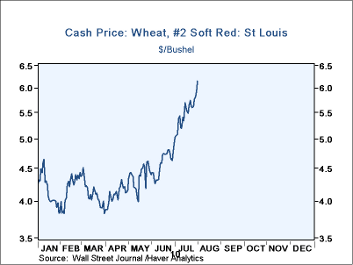
Wheat prices, as shown in the first chart, have risen sharply over the past few weeks as the implications of the severe weather conditions in many wheat growing countries for their wheat crop have become clear. (These are daily cash [...]
Wheat prices, as shown in the first chart, have risen sharply over the past few weeks as the implications of the severe weather conditions in many wheat growing countries for their wheat crop have become clear. (These are daily cash prices that can be found in the Haver data bases: DAILY and INTDAILY. Futures prices can be found in CBOT, Chicago Board of Trade, in the data base: CMDTY.)
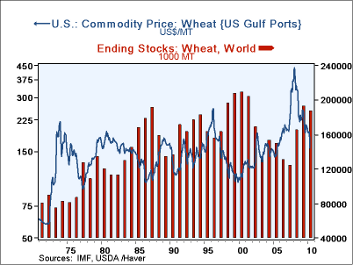
Droughts in Russia, Ukraine, Kazakhstan, and Australia and heavy rains at the planting of the latest crop in Canada have significantly reduced the outlook for wheat production in these countries. They have also brought to mind the early seventies, a time of another Russian crop failure when wheat prices almost tripled and more recently the 2007-8 food crisis when the prices of most grains almost doubled, inciting food riots in such countries as Haiti and Bangladesh. The spikes in prices on these occasions are shown in the second chart which shows the prices on a log scale so that differences in the data represent not equal arithmetical but equal percentage changes. (The longest historical series for wheat prices can be found in the IFS data base with monthly commodity price data that run from January 1957 to date. Three prices for wheat are shown: one for Australia. one for Argentina and one for the U.S. We have used the U. S. price in the chart.)
Also shown on the second chart are world stocks of wheat. In addition to data on stocks, much other relevant data for analyzing the world wide wheat situation can be found in the extensive Haver Data Base, USDA, World Agriculture Statistics. This data base contains, in addition to data on stocks, information on production, exports and imports, consumption and yields of some thirteen general types of agricultural commodities and their sub divisions for some 70 countries and the EU27 total. In both the early '70s and the 2007-8 explosion in wheat prices, world wheat stocks were low as can be seen in the second chart. Today's relatively high level of stocks might prove to be a damper on the rise in the wheat price.
More Economy in Brief
 Global| Feb 05 2026
Charts of the Week: Balanced Policy, Resilient Data and AI Narratives
by:Andrew Cates


