 Global| May 02 2006
When Shoppers Shop ...
by:Tom Moeller
|in:Economy in Brief
Summary
Chain store sales jumped another 0.7% last week and more than recouped the prior period's 0.2% decline, according to the International Council of Shopping Centers (ICSC)-UBS survey. The late-month recovery lifted April chain store [...]
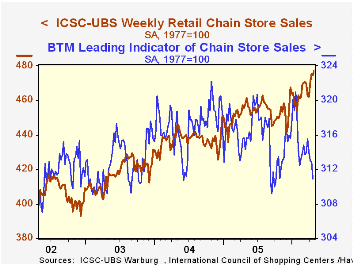
Chain store sales jumped another 0.7% last week and more than recouped the prior period's 0.2% decline, according to the International Council of Shopping Centers (ICSC)-UBS survey.
The late-month recovery lifted April chain store sales 1.6% above the March average which rose 0.7% from February. The April gain was the largest in over two years and during the first four months of 2006, chain store sales rose at a 14% annual rate.
During the last ten years there has been a 47% correlation between the y/y change in chain store sales and the change in nonauto retail sales less gasoline.
The chain store sales leading indicator fell 0.6% during the latest week (-1.4% y/y) marking the third decline in the last four periods. In April, the leading indicator is down 0.7% from the March average which rose 0.3% from February.The ICSC-UBS retail chain-store sales index is constructed using the same-store sales (stores open for one year) reported by 78 stores of seven retailers: Dayton Hudson, Federated, Kmart, May, J.C. Penney, Sears and Wal-Mart.
Cross-Country Personal Saving Rates from the Federal Reserve Bank of St. Louis is available here.
| ICSC-UBS (SA, 1977=100) | 04/29/06 | 04/22/06 | Y/Y | 2005 | 2004 | 2003 |
|---|---|---|---|---|---|---|
| Total Weekly Chain Store Sales | 477.7 | 474.6 | 4.3% | 3.6% | 4.7% | 2.9% |
by Tom Moeller May 2, 2006
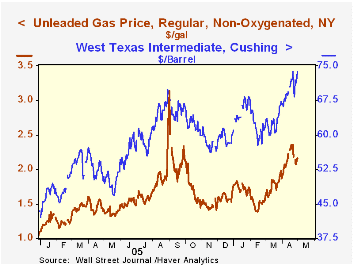
Retail gasoline prices rose less than one penny last week to $2.92 per gallon (30.6% y/y). The near-stability followed four consecutive weeks of increase which ranged between nine and thirteen cents per week.
Earlier signs of relief from the recent upward pressure on prices reversed a bit yesterday as the spot market price for regular unleaded rose a nickel. Nevertheless, the latest spot price at $2.17 per gallon was down from the high of $2.35 during mid-April.
The price of West Texas Intermediate crude oil also move up yesterday to $73.71 per barrel, twelve cents short of the record high.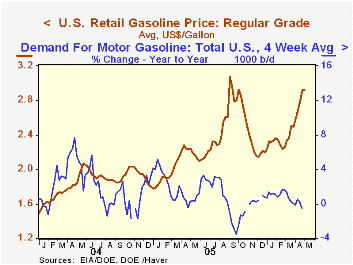
The jump in gasoline prices has been accompanied by a sharp slowdown in gasoline demand. Through the latest four weeks, demand versus the year ago level went negative by 0.5%, the first negative y/y comparison since last Autumn when gas prices were similarly elevated.
The latest Short-Term Energy and Summer Fuels Outlook from the U.S. Energy Information Administration can be found here.
| US Weekly | 05/01/06 | 04/24/06 | Y/Y | 2005 | 2004 | 2003 |
|---|---|---|---|---|---|---|
| U.S. Retail Gasoline, Regular per Gal. | $2.92 | $2.91 | 30.6% | $2.27 | $1.85 | $1.56 |
by Tom Moeller May 2, 2006
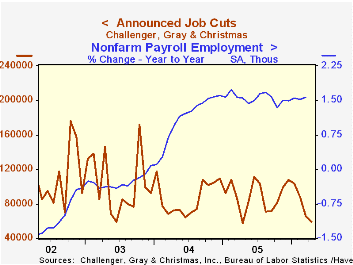
Announced job cuts fell another 8.1% last month on top of the 25.7% m/m decline during March, according to the Challenger, Grey & Christmas survey. The decline was to the lowest level since last April.
During the last ten years there has been an 83% (inverse) correlation between the three month moving average level of announced job cuts and the three month change payroll employment.
Layoffs in the apparel industry dropped sharply (-52.2% y/y) as did job cuts in financial (-37.8 y/y, industrial goods (-5.5% y/y), pharmaceutical (-67.3% y/y) and retail (-82.6% y/y). Announced job cuts in electronics (-74.0% y/y) and automotive industries (139.2% y/y) rose m/m.
Job cut announcements differ from layoffs. Many are achieved through attrition, early retirement or just never occur.
Challenger also reported a sharp m/m increase in announced hiring plans (81.7% y/y).
| Challenger, Gray & Christmas | April | Mar | Y/Y | 2005 | 2004 | 2003 |
|---|---|---|---|---|---|---|
| Announced Job Cuts | 59,688 | 64,975 | 3.2% | 1,072,054 | 1,039,935 | 1,236,426 |
by Louise Curley May 2, 2006
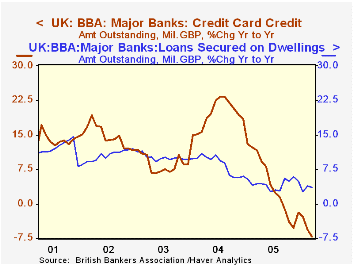
The British Bankers' Association released figures on mortgage and consumer credit lending today. Outstanding mortgages were up 0.12% from February and 3.54% above March 2005. Consumer credit outstanding, on the contrary, declined 1.82% from February and was 7.18% below March, 2005.
The year-to-year changes in outstanding mortgage and consumer credit have been declining since mid-2004. The deceleration in mortgages has been modest compared to that in consumer credit as can be seen in the first chart.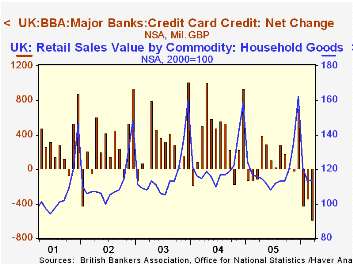
The decline in credit card debt is reflected in the decline over the past year or so in retail sales of household goods. The second chart shows the year-to-year change in retail sales of household goods and the net increase in consumer credit outstandings. Both series are seasonally unadjusted.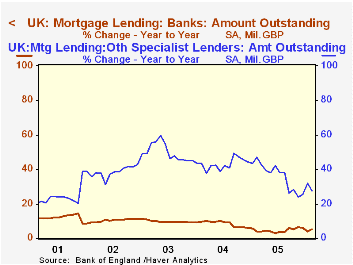
Banks have been playing a smaller proportional role in mortgage lending as Other Specialist Lenders (Non-bank UK credit grantors and specialist mortgage lenders) have taken a larger share of the market. Banks' share in the market has gone from 72.0% in 2000 to 59.4% in 2005, while that of Other Specialist Lenders has risen from 7.7% to 22.3%. The share of Building Societies has declined moderately from 20.0% to 17.9%. The share of other lenders has been insignificant. The year-to-year changes in outstanding mortgages at Banks and at Other Specialist lenders are shown in the third chart. While the yearly increases in Other Specialist Lenders have been declining they are still increasing at rates of almost 30% compared to about 5% for Banks.
| United Kingdom | Mar 06 | Feb 06 | Mar 05 | M/M % | Y/Y % | 2005 | 2004 | 2003 |
|---|---|---|---|---|---|---|---|---|
| BBA Consumer Credit Outstanding (Bil. GBP) | 31.2 | 31.8 | 33.6 | -1.82 | -7.18 | 33.4 | 34.0 | 28.7 |
| BBA Mortgages Outstanding (Bil.GBP) | 513.6 | 513.0 | 496.1 | 0.12 | 3.54 | 521.1 | 496.4 | 468.4 |
| Mortgage Lending by: % | 2005 | 2004 | 2003 | 2002 | 2001 | 2000 | -- | -- |
| Banks | 59.4 | 61.8 | 65.9 | 69.1 | 41.0 | 72.0 | -- | -- |
| Building Societies | 17.9 | 18.2 | 18.4 | 18.3 | 19.2 | 20.0 | -- | -- |
| Other Specialist Lenders | 22.3 | 19.6 | 15.4 | 12.1 | 9.7 | 7.7 | -- | -- |
| Other Lenders | 0.0 | 0.0 | 0.0 | 0.0 | 0.0 | 0.0 | -- | -- |

Tom Moeller
AuthorMore in Author Profile »Prior to joining Haver Analytics in 2000, Mr. Moeller worked as the Economist at Chancellor Capital Management from 1985 to 1999. There, he developed comprehensive economic forecasts and interpreted economic data for equity and fixed income portfolio managers. Also at Chancellor, Mr. Moeller worked as an equity analyst and was responsible for researching and rating companies in the economically sensitive automobile and housing industries for investment in Chancellor’s equity portfolio. Prior to joining Chancellor, Mr. Moeller was an Economist at Citibank from 1979 to 1984. He also analyzed pricing behavior in the metals industry for the Council on Wage and Price Stability in Washington, D.C. In 1999, Mr. Moeller received the award for most accurate forecast from the Forecasters' Club of New York. From 1990 to 1992 he was President of the New York Association for Business Economists. Mr. Moeller earned an M.B.A. in Finance from Fordham University, where he graduated in 1987. He holds a Bachelor of Arts in Economics from George Washington University.
More Economy in Brief

 Global| Feb 05 2026
Charts of the Week: Balanced Policy, Resilient Data and AI Narratives
by:Andrew Cates

