 Global| May 01 2019
Why Isn't Consumer Price Inflation Higher? Might Ancient Monetary Theory Hold the Answer?
Summary
In the four quarters ended Q1:2019, the chain-price index for personal consumption expenditures increased 1.4%, down from 1.9% in the four quarters ended Q4:2018. This was the slowest increase since 1.0% in the four quarters ended [...]
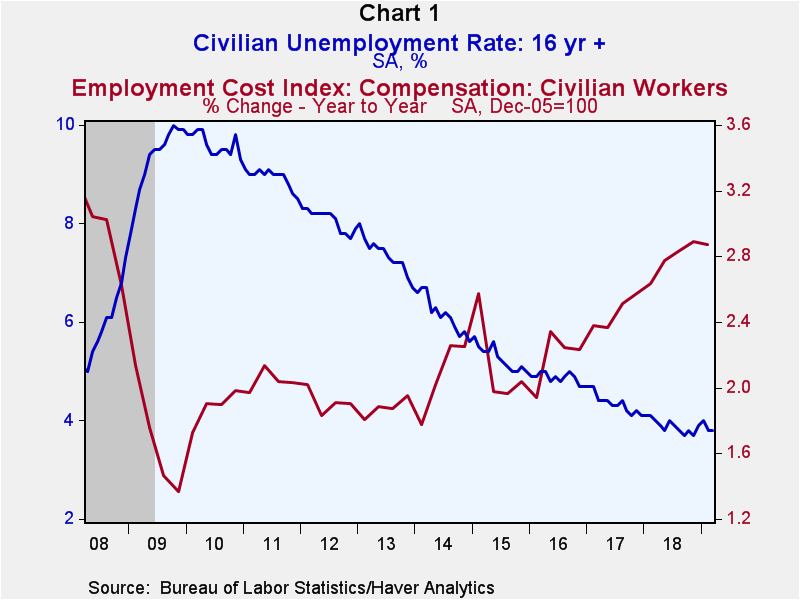
In the four quarters ended Q1:2019, the chain-price index for personal consumption expenditures increased 1.4%, down from 1.9% in the four quarters ended Q4:2018. This was the slowest increase since 1.0% in the four quarters ended Q3:2016. How can it be that consumer price inflation remains so tame in the face of extraordinarily low unemployment rates and increasing growth in employee compensation (see Chart 1)? The answer could be related to what I like to call Ancient Monetary Theory (AMT). AMT states that goods/price inflation is always and everywhere a function of monetary aggregate quantities. That is, “money” is the root of all sustained goods/services price inflation.
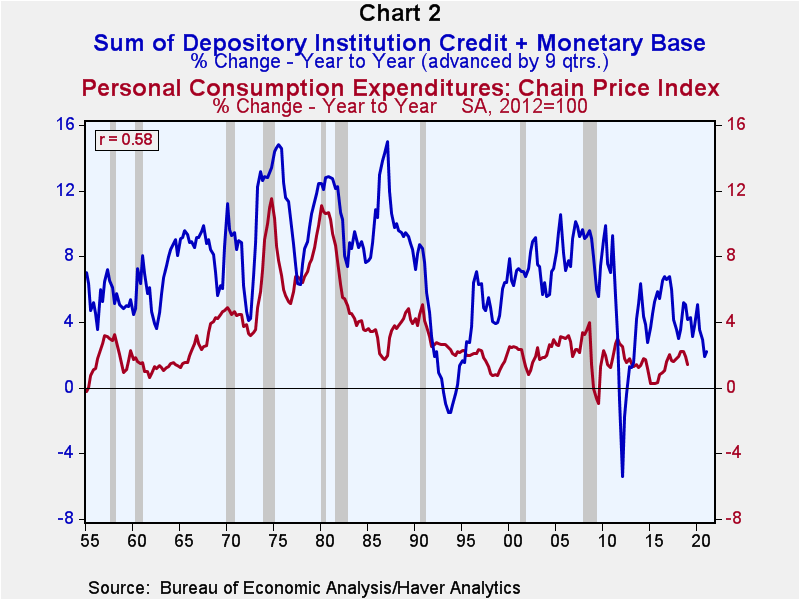
Now, let us examine the relationship between the year-over-year percent changes in the chain-price index for personal consumption expenditures and the year-over-year percent changes in a monetary variable this ancient monetary theorist calls thin-air credit. Thin-air credit is the sum of credit created by depository institutions (primarily commercial banks, saving banks and credit unions) and the monetary base. The monetary base is composed of deposits held at the Federal Reserve owed to depository institutions and all currency issued by the Federal Reserve. When the depository institution system creates additional credit, i.e., makes new loans or purchases securities, this credit is created figuratively out of thin air. When the Fed purchases securities, it, too, is creating credit figuratively out of thin air. The Fed's thin-air credit is the “stuff” of the monetary base. The unique characteristic of thin-air credit is that the recipient of it can increase their spending on goods, services and/or assets without necessitating anyone else to cut back on their current spending. The highest correlation between year-over-year percent changes in thin-air credit and the chain-price index for personal consumption expenditures starting in Q1:1955 through Q1:2019 is obtained when the percent changes in thin-air credit are advanced by 9 quarters in relation to percent changes in the price index. The value of this correlation is 0.58 vs. a maximum value of 1.00. This means that percent changes in thin-air credit lead consumer inflation rates. These data are plotted in Chart 2.
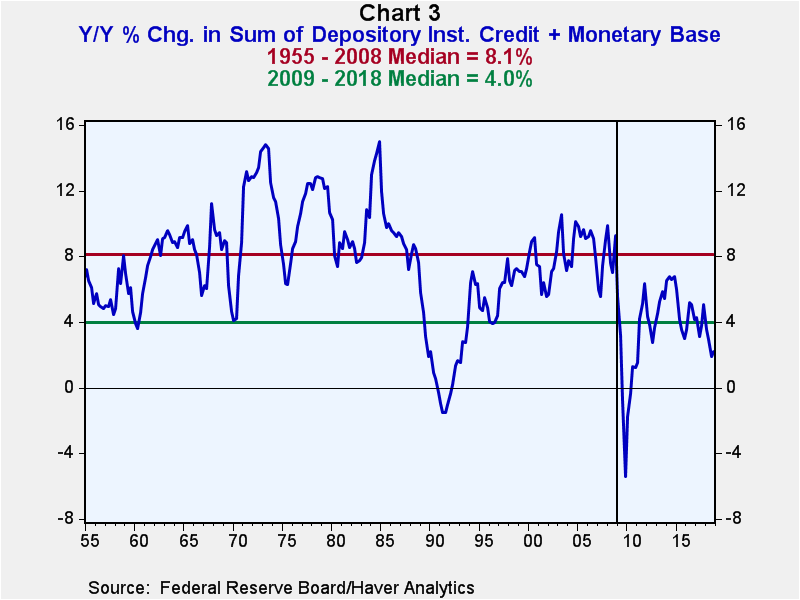
There has been a sharp deceleration in total thin-air credit growth starting in 2009. Starting in Q1:1955 through Q4:2008, the median year-over-year percent change in thin-air credit was 8.1%. Starting in Q:1:2009 through Q4:2018, the median year-over-year growth in thin-air credit slowed to 4.0%. (See Chart 3). According to Ancient Monetary Theory, this sharp deceleration in thin-air credit growth would account for the persistence of relatively low consumer price inflation in the post-Great Recession era.
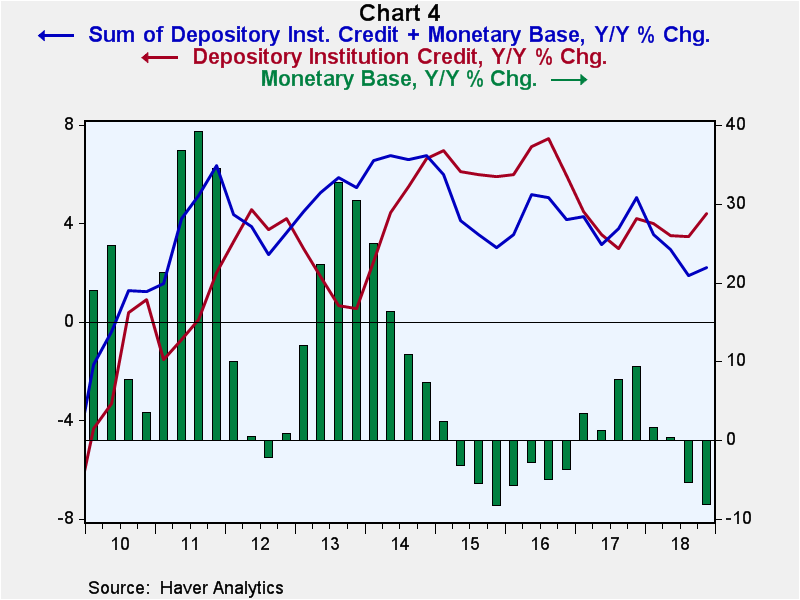
Plotted in Chart 4 are the year-over-year percent changes in total thin-air credit (the red line) and its separate components, depository institution credit (the blue line) and the monetary base (the green bars) from Q1:2010 through Q4:2018. In two periods of intense Fed quantitative easing (QE), 2011 and 2013, the rapid growth in the monetary base that resulted from QE boosted total thin-air credit growth as growth in depository institution credit slowed. In contrast, in 2018, Fed quantitative tightening retarded growth in total thin-air credit, which caused a contraction in the monetary base, as growth in depository institution credit picked up.
Ancient Monetary Theory posits that consumer price inflation is a function of the behavior of monetary aggregate quantities. My research suggests that the behavior of thin-air credit is a relatively good predictor of future consumer price inflation trends. My research also suggests that there is a long lag, over two years, between growth in thin-air credit and the consumer price inflation rate. Thus, how the Fed allows thin-air credit to behave today has an important effect on the consumer price inflation rate two years hence. If the Fed wants to stabilize consumer price inflation, it ought to stabilize the growth of thin-air credit.
Paul L. Kasriel
AuthorMore in Author Profile »Mr. Kasriel is founder of Econtrarian, LLC, an economic-analysis consulting firm. Paul’s economic commentaries can be read on his blog, The Econtrarian. After 25 years of employment at The Northern Trust Company of Chicago, Paul retired from the chief economist position at the end of April 2012. Prior to joining The Northern Trust Company in August 1986, Paul was on the official staff of the Federal Reserve Bank of Chicago in the economic research department. Paul is a recipient of the annual Lawrence R. Klein award for the most accurate economic forecast over a four-year period among the approximately 50 participants in the Blue Chip Economic Indicators forecast survey. In January 2009, both The Wall Street Journal and Forbes cited Paul as one of the few economists who identified early on the formation of the housing bubble and the economic and financial market havoc that would ensue after the bubble inevitably burst. Under Paul’s leadership, The Northern Trust’s economic website was ranked in the top ten “most interesting” by The Wall Street Journal. Paul is the co-author of a book entitled Seven Indicators That Move Markets (McGraw-Hill, 2002). Paul resides on the beautiful peninsula of Door County, Wisconsin where he sails his salty 1967 Pearson Commander 26, sings in a community choir and struggles to learn how to play the bass guitar (actually the bass ukulele). Paul can be contacted by email at econtrarian@gmail.com or by telephone at 1-920-559-0375.
More Economy in Brief
 Global| Feb 05 2026
Charts of the Week: Balanced Policy, Resilient Data and AI Narratives
by:Andrew Cates


