 Global| Jul 25 2011
World Trade Data In Haver Data Bases
Summary
The Netherlands Bureau for Economic Policy Analysis, (CPB) complies the most up to date data on world trade. The latest data, in the form of indexes with a base year of 2000 are for May and were published today. The volume of world [...]
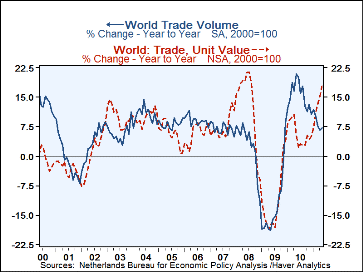
The Netherlands Bureau for Economic Policy Analysis, (CPB) complies the most up to date data on world trade. The latest data, in the form of indexes with a base year of 2000 are for May and were published today. The volume of world trade--the sum of world exports and imports--increased 2.3% in May after declining 2.2% in April. The trend, measured by the year over year percentage change, is clearly pointing downward. The value of trade, however, shows an upward trend in spite of a slight decline of 0.4% in May. The year to year change in the value of world trade, which has been rising steadily since November of last year, when it was 4.3%, rose to 18.0% in May. The upward trend is a result of rising prices in both exports and imports. The year to year changes in the volume and value of world trade are shown in the first chart.
The data from CPB are shown in the Haver data base G10 under regional aggregates. Data for world trade are also available in the OECD and IFS data bases, however, these latter data are less timely than CPB data. The monthly data lag the CPB data by 2 months and other data are available only quarterly or annually.
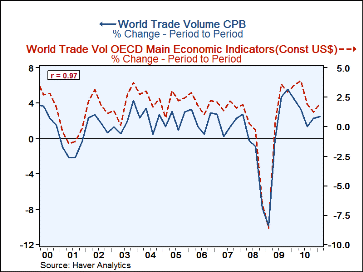
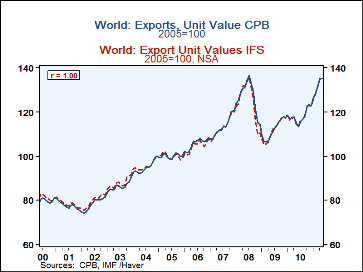
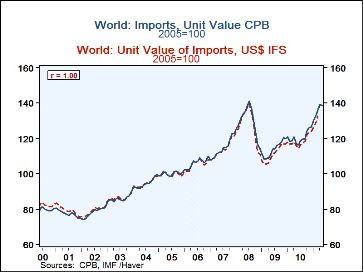
In the second chart we compare the period to period changes in the CPB data and the OECD, Main Economic Indicators. The latter data are quarterly, include services as well as goods and are express in constant U. S. dollars. There is a high correlation (97) between the quarter to quarter changes in the two series. A similar comparison between monthly IFS and CPB data on unit values of imports and exports show statistically perfect correlations as can be seen in the third and fourth charts. The CPB data appear to be good early indicators of world trade.
Note: As well as world trade, CPB compiles data on world production, which is also shown under regional aggregates in G10. World production increased 0.8% in May from April and was 4.8% above May 2010.
More Economy in Brief
 Global| Feb 05 2026
Charts of the Week: Balanced Policy, Resilient Data and AI Narratives
by:Andrew Cates


