Global| Jul 25 2024
Charts of the Week: It’s the Economy, Stupid!
by:Andrew Cates
|in:Economy in Brief
Summary
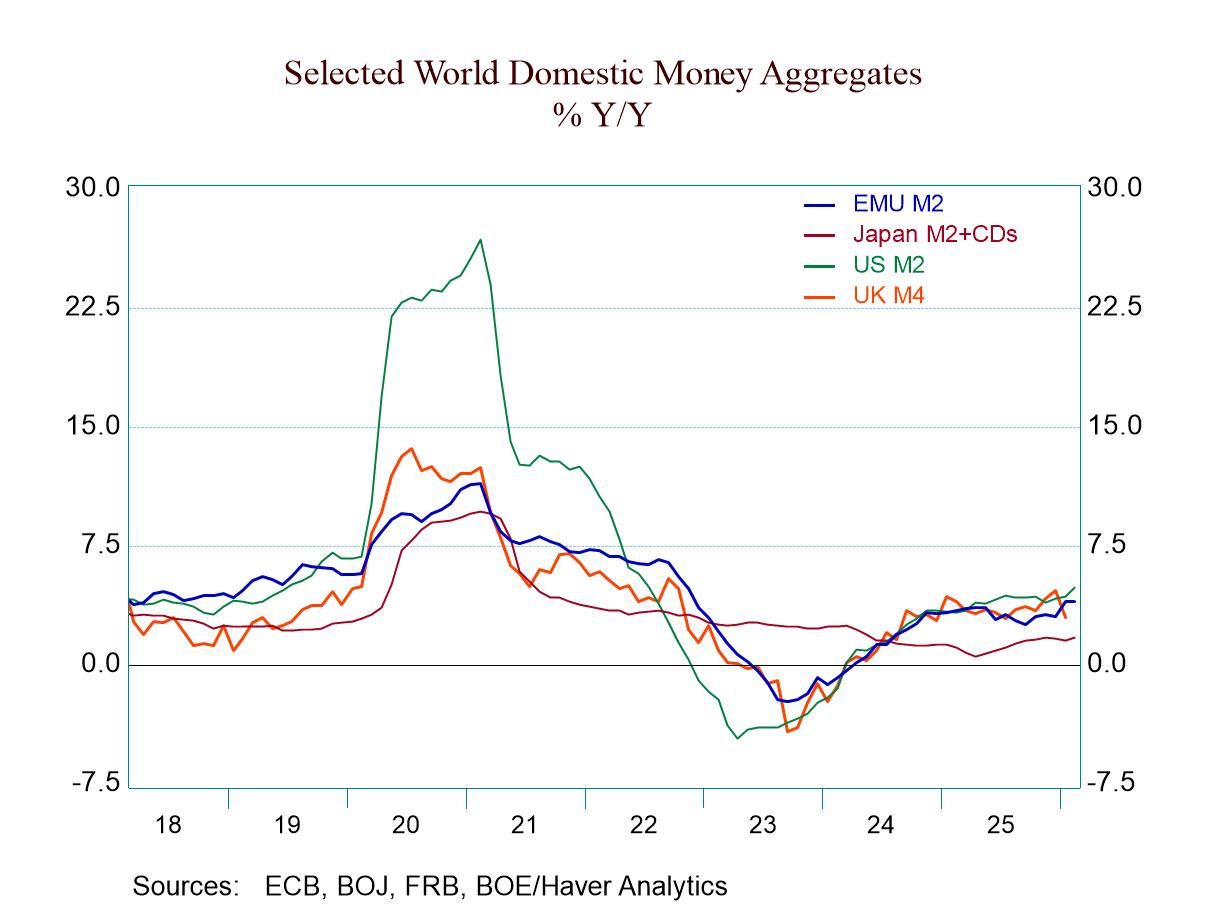
Politics has continued to dominate the headlines in recent days and will doubtless remain a big focus in the immediate weeks ahead. In the background, however, incoming data have suggested the outlook for the world economy has been darkening (chart 1) probably because more restrictive policy settings are now more forcibly weighing on aggregate demand (charts 2 and 3). However, still-sticky service sector inflation (chart 4) could postpone any moves to (further) ease the stance of monetary policy not least if traded goods price inflation now begins to stir (chart 5). This week’s evidence suggesting robust demand for semiconductors has continued to support global trade also serves as a reminder that there are some tailwinds behind the world economy at present that are countering policy-related headwinds (chart 6).
Financial markets are still dancing with economic data Financial markets have continued to dance with the incoming economic data over the last few months. Chart 1 below specifically suggests that equity investors have responded favourably to positive global growth surprises and negative inflation surprises, while negative growth and higher inflation have dampened their enthusiasm. Given this pattern, the bullish momentum seen in equity markets during the first half of 2024 seems increasingly at odds with the recent slew of disappointing global growth data.
Chart 1: Global equity market momentum versus global growth and inflation surprises

Households have started to rebuild savings buffers Digging into the numbers reveals that incoming data for labour market activity have been disappointing expectations much more frequently in recent weeks, most notably in the US. Unemployment rates, for instance, have been climbing, job vacancies have been falling and employment growth has been slowing. And this, in turn, has coincided with a greater desire by households in several economies to rebuild their savings buffers (see chart 2).
Chart 2: Unemployment rates and household saving rates in advanced economies

Credit impulses are negative It is arguably no coincidence that at the same time as this, evidence has been accumulating to suggest that higher interest rates and less accommodative fiscal policy settings are taking a toll. Haver’s calculations for the impulse that’s being provided to the world economy from credit growth to the private sector, for example, has now been waning since the end of 2022 and negative in the 4 quarters to Q1 2024 (see chart 3).
Chart 3: Haver’s calculations for the global credit impulse

Still-high service sector inflation There are, nevertheless, no guarantees that this restraint will now generate a more coordinated response from the world’s central banks to ease monetary policy in the immediate weeks ahead. Service sector inflation in many major economies is still worryingly high for example (see chart 4). And notwithstanding looser labour markets, wage inflation is still pretty high as well.
Chart 4: Service sector and goods sector CPI inflation in advanced economies

Firming global shipping costs There are also now heightened concerns that goods price inflation could start climbing more forcibly. Measured with respect to the Drewry Container Index, global shipping rates have nearly doubled since late April. The main reason concerns some further disruption in the Red Sea, which has stretched global shipping capacity, with more shipping needed to service European and Asian routes. As chart 5 below suggests, this could now generate more upward pressure on producer price inflation in the period ahead.
Chart 5: Global shipping costs versus PPI inflation in advanced economies

Roaring semiconductor trade in South Korea Global traded goods price inflation has already begun to stir, however, partly thanks to stronger global demand for some goods in some economies. As this final chart suggests, this week’s data from South Korea revealed still-firm demand for semiconductors, and firmer pricing power in that sector as well.
Chart 6: South Korea: Semiconductor PPI inflation and export growth


Andrew Cates
AuthorMore in Author Profile »Andy Cates joined Haver Analytics as a Senior Economist in 2020. Andy has more than 25 years of experience forecasting the global economic outlook and in assessing the implications for policy settings and financial markets. He has held various senior positions in London in a number of Investment Banks including as Head of Developed Markets Economics at Nomura and as Chief Eurozone Economist at RBS. These followed a spell of 21 years as Senior International Economist at UBS, 5 of which were spent in Singapore. Prior to his time in financial services Andy was a UK economist at HM Treasury in London holding positions in the domestic forecasting and macroeconomic modelling units. He has a BA in Economics from the University of York and an MSc in Economics and Econometrics from the University of Southampton.
More Economy in Brief
 Global| Mar 26 2026
Charts of the Week: A Supply-Constrained World Comes into Sharper Focus
by:Andrew Cates