 Global| Sep 27 2002
2Q GDP Growth Revised Up Slightly to 1.3%
by:Tom Moeller
|in:Economy in Brief
Summary
GDP growth last quarter was revised slightly higher due to lessened deterioration in the trade deficit. Revisions elsewhere were minor. Domestic final demand growth of 1.3% was unrevised. Growth in consumer spending (1.8%) and capital [...]

GDP growth last quarter was revised slightly higher due to lessened deterioration in the trade deficit. Revisions elsewhere were minor.
Domestic final demand growth of 1.3% was unrevised. Growth in consumer spending (1.8%) and capital spending on equipment (3.3%) were little revised and offset another sharp decline in business spending on structures (-17.6%).
Trade sector deterioration was lessened due to a raised estimate of exports (14.3%, AR). Imports surged 22.2%.
Production increases to slow the rate of inventory decumulation were little revised.
Corporate profits with IVA and CCA adjustments fell 6.2% (AR) and were little revised. It was the second consecutive quarterly decline near that rate. After tax profits rose 6.9% (AR), strong for the second consecutive quarter.
Estimated inflation was little revised at half last year's pace.
For a report from the St. Louis Fed on measuring recession severity, click here.
For another St. Louis Fed report which asks whether it was a recession, click here.
| Chained '96 $, % AR | 2Q'02 (Final) | 2Q'02 (Prelim.) | 1Q'02 | Y/Y | 2001 | 2000 | 1999 |
|---|---|---|---|---|---|---|---|
| GDP | 1.3% | 1.1% | 5.0% | 2.2% | 0.3% | 3.8% | 4.1% |
| Inventory Effect | 1.3% | 1.4% | 2.6% | 0.6% | -1.2% | 0.1% | -0.2% |
| Final Sales | -0.1% | -0.3% | 2.4% | 1.6% | 1.5% | 3.7% | 4.3% |
| Trade Effect | -1.4% | -1.7% | -0.8% | -0.6% | -0.1% | -0.6% | -0.9% |
| Domestic Final Demand | 1.3% | 1.3% | 3.0% | 2.2% | 1.6% | 4.3% | 5.2% |
| Chained GDP Price Deflator | 1.2% | 1.1% | 1.3% | 1.1% | 2.4% | 2.1% | 1.4% |
by Tom Moeller September 27, 2002

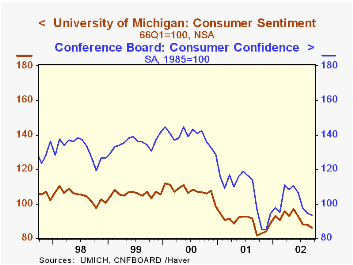
Consumer Sentiment for all of September month according to the University of Michigan came in near the mid-month reading. Sentiment fell 1.7% (m/m) and that was the sixth monthly decline this year.
Indexes of consumer expectations and current conditions fell. Both are down roughly 3% YTD.
The University of Michigan survey is not seasonally adjusted.
For a discussion of consumer confidence and sentiment in the aftermath of September 11th click here.
| University of Michigan | Sept. | Aug | Y/Y | 2001 | 2000 | 1999 |
|---|---|---|---|---|---|---|
| Consumer Sentiment | 86.1 | 87.6 | 5.3% | 89.2 | 107.6 | 105.8 |
Tom Moeller
AuthorMore in Author Profile »Prior to joining Haver Analytics in 2000, Mr. Moeller worked as the Economist at Chancellor Capital Management from 1985 to 1999. There, he developed comprehensive economic forecasts and interpreted economic data for equity and fixed income portfolio managers. Also at Chancellor, Mr. Moeller worked as an equity analyst and was responsible for researching and rating companies in the economically sensitive automobile and housing industries for investment in Chancellor’s equity portfolio. Prior to joining Chancellor, Mr. Moeller was an Economist at Citibank from 1979 to 1984. He also analyzed pricing behavior in the metals industry for the Council on Wage and Price Stability in Washington, D.C. In 1999, Mr. Moeller received the award for most accurate forecast from the Forecasters' Club of New York. From 1990 to 1992 he was President of the New York Association for Business Economists. Mr. Moeller earned an M.B.A. in Finance from Fordham University, where he graduated in 1987. He holds a Bachelor of Arts in Economics from George Washington University.


