 Global| Jul 31 2002
2Q GDP Weak, Past Data Revised Down
by:Tom Moeller
|in:Economy in Brief
Summary
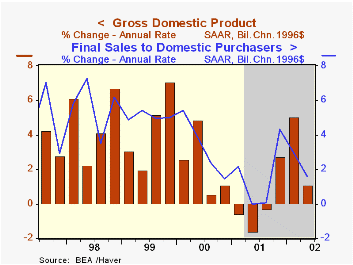
GDP growth last quarter was quite a bit weaker than Consensus expectations for a 2.3% rise. Growth during prior quarters was revised lower including three consecutive quarters of negative growth in early 2001. Weakness last quarter [...]

GDP growth last quarter was quite a bit weaker than Consensus expectations for a 2.3% rise. Growth during prior quarters was revised lower including three consecutive quarters of negative growth in early 2001.
Weakness last quarter was due to weak domestic final demand and the sharpest subtraction from growth due to the foreign sector since 1Q99. A lowered estimate of domestic final demand accounted for most of the downward revision to GDP growth last year.
Trade sector deterioration sapped 1.8 percentage points from GDP growth. Exports grew 11.7% (AR) but imports surged 23.5% due to much higher imports of consumer and capital goods.
Real PCE growth slowed to 1.9% from 3.1% in 1Q and 6.0% in 4Q01. Residential investment also slowed to 4.9% from a heated 14.3% in 1Q. Fixed capital investment grew for the first quarter since 3Q 2000. Higher spending on equipment and software offset declines in industrial and transportation equipment. For a discussion of the prospects for capital spending go to: http://research.stlouisfed.org/publications/net/cover.pdf
Production increases to slow the rate of inventory decumulation added to GDP growth over the last two quarters following six quarters of drag.
Inflation remained low following a decline in prices in 4Q01.
| Chained '96 $, % AR | 2Q'02 (Advance) | 1Q'02 | Y/Y | 2001 | 2000 | 1999 |
|---|---|---|---|---|---|---|
| GDP | 1.1% | 5.0% | 2.1% | 0.3% | 3.8% | 4.1% |
| Inventory Effect | 1.2% | 2.6% | 0.6% | -1.2% | 0.1% | -0.2% |
| Final Sales | -0.1% | 2.4% | 1.5% | 1.5% | 3.7% | 4.3% |
| Trade Effect | -1.8% | -0.8% | -0.7% | -0.1% | -0.6% | -0.9% |
| Domestic Final Demand | 1.6% | 3.0% | 2.2% | 1.6% | 4.3% | 5.2% |
| Chained GDP Price Deflator | 1.2% | 1.3% | 1.0% | 2.4% | 2.1% | 1.4% |
by Tom Moeller July 31, 2002

The Chicago Purchasing Manager’s Index of Business activity fell more than expected in July. The index has now retraced most of the improvement of earlier this year
The indexes of new orders and production, inventories fell sharply. Employment and delivery speeds were down just slightly and inventories rose.
The prices paid index rose sharply to the highest level since September 2000.
| Chicago Purchasing Managers Index, SA | July | June | Y/Y | 2001 | 2000 | 1999 |
|---|---|---|---|---|---|---|
| Business Barometer | 51.5 | 58.2 | 38.1 | 41.4 | 51.8 | 56.5 |
| Prices Paid | 64.5 | 58.2 | 47.9 | 50.5 | 65.6 | 57.6 |
Tom Moeller
AuthorMore in Author Profile »Prior to joining Haver Analytics in 2000, Mr. Moeller worked as the Economist at Chancellor Capital Management from 1985 to 1999. There, he developed comprehensive economic forecasts and interpreted economic data for equity and fixed income portfolio managers. Also at Chancellor, Mr. Moeller worked as an equity analyst and was responsible for researching and rating companies in the economically sensitive automobile and housing industries for investment in Chancellor’s equity portfolio. Prior to joining Chancellor, Mr. Moeller was an Economist at Citibank from 1979 to 1984. He also analyzed pricing behavior in the metals industry for the Council on Wage and Price Stability in Washington, D.C. In 1999, Mr. Moeller received the award for most accurate forecast from the Forecasters' Club of New York. From 1990 to 1992 he was President of the New York Association for Business Economists. Mr. Moeller earned an M.B.A. in Finance from Fordham University, where he graduated in 1987. He holds a Bachelor of Arts in Economics from George Washington University.
More Economy in Brief
 Global| Feb 05 2026
Charts of the Week: Balanced Policy, Resilient Data and AI Narratives
by:Andrew Cates


