 Global| Feb 14 2020
737 MAX and Utilities Push U.S. Industrial Production Lower
Summary
• Industrial production declined 0.3% in January with both manufacturing and utility output contracting. • Factory production edged down 0.1% as the 737 MAX shutdown led to a 10.7% plummet in aircraft. • Utility output fell 4.0% with [...]
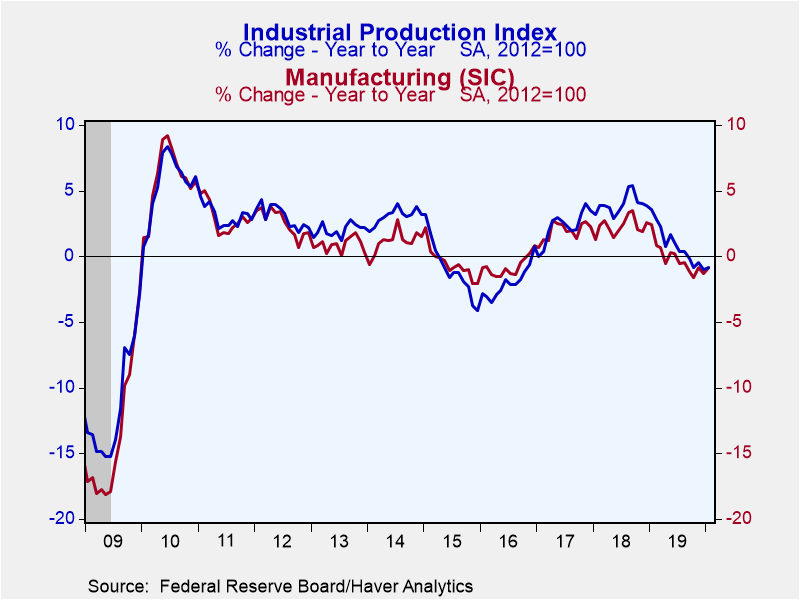
• Industrial production declined 0.3% in January with both manufacturing and utility output contracting.
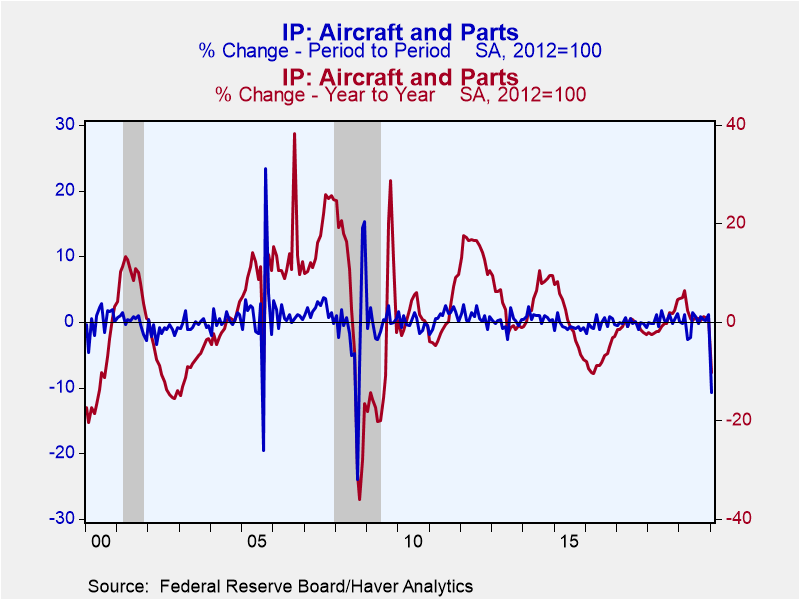
• Factory production edged down 0.1% as the 737 MAX shutdown led to a 10.7% plummet in aircraft.
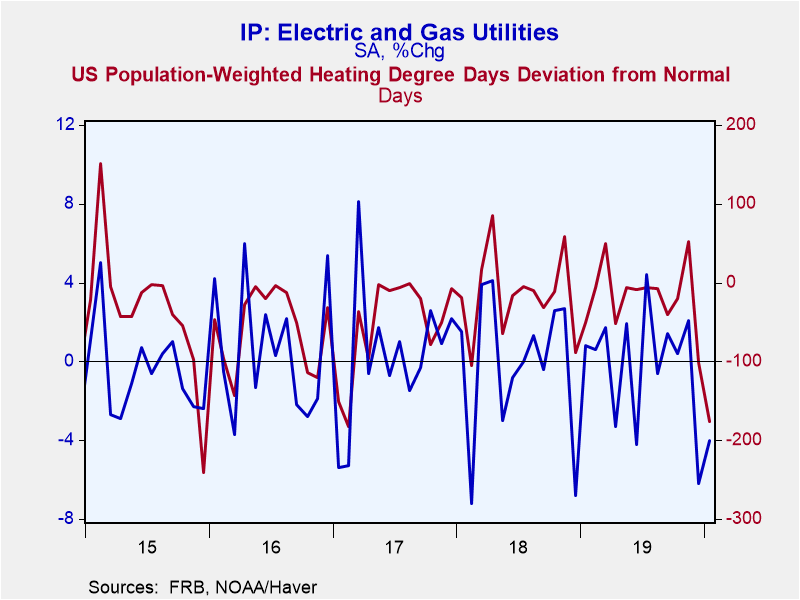
• Utility output fell 4.0% with one of the warmest January’s on record.
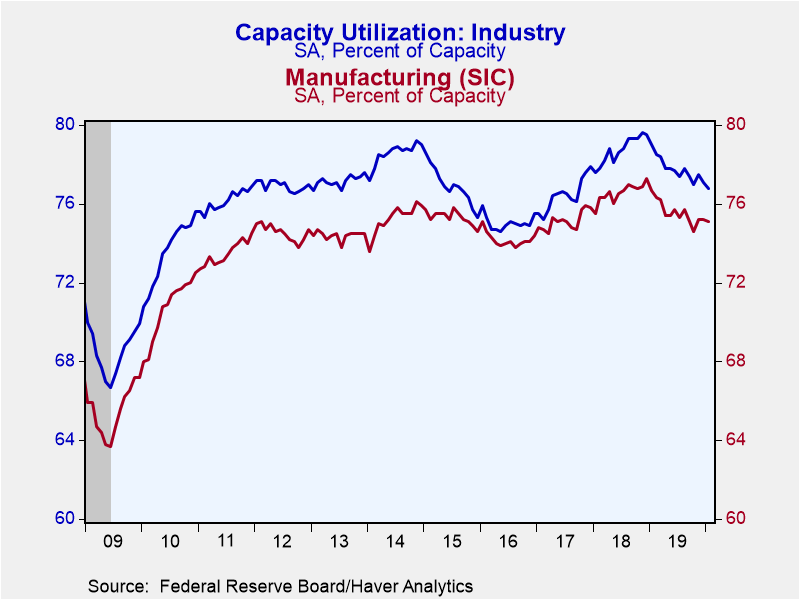
• Capacity utilization in the manufacturing sector down to 75.1%, well below December 2018 cycle peak of 77.3%.
Industrial production decreased 0.3% in January (-0.8% year-on-year) following offsetting revisions to November and December – now -0.4% and +0.9% revised from -0.3% and +0.8% respectively. The Action Economics Survey forecast a 0.3% decline in January.
Manufacturing activity edged down 0.1% (-0.8% y/y) during January, with a slight downward revision to December (now 0.1% versus 0.2%). Utilities production fell 4.0% (-6.2% y/y), as much warmer-than-normal weather in January decreased demand. U.S. population-weighted heating was 176 degree-days below normal. The only warmer January by this measure occurred in 2006. Meanwhile mining activity rose 1.2% (3.1% y/y).
Manufacturing of durable goods declined 0.5% (-0.8% y/y) in January, with aircraft production plunging 10.7% (-10.2% y/y). This 737 MAX production-halt-related drop is the largest non-strike driven decline in aircraft output. In September 2008, plane production plummeted a record 24.0% when Boeing machinists struck, but then had double-digit rebounds in November and December after the strike ended. Motor vehicle output grew 2.4% (0.8% y/y) while machinery output declined 1.1% (-4.6% y/y). Nondurable output increased 0.3% (-0.6% y/y).
Output of business equipment, an indicator of capital spending, fell 2.6% in January (-4.5% y/y). In the special aggregate groupings, production of high technology products, which is now less than 2% of total output, increased 0.8% (8.9% y/y). Factory sector production excluding the motor vehicle and high tech sectors decreased 0.3% (-1.1% y/y), and remains 11% below its 2007 peak.
Capacity utilization declined to 76.8% in January from a slightly upwardly-revised 77.1% (was 77.0%). The Action Economics Survey expected 76.8%. Factory sector use edged down to 75.1% and is down 2.2 percentage points from December 2018’s cyclical peak. Utility utilization fell to 70.6%, the lowest on record (data began in 1967). Capacity in the manufacturing sector grew 1.3% y/y, the second month it has surpassed its 2008 peak.
Industrial production and capacity data and US Population-Weighted Heating and Cooling Days are included in Haver's USECON database. Additional detail on production and capacity can be found in the IP database. The expectations figures come from the AS1REPNA database.
| Industrial Production (SA, % Change) | Jan | Dec | Nov | Jan Y/Y | 2019 | 2018 | 2017 |
|---|---|---|---|---|---|---|---|
| Total Output | -0.3 | -0.4 | 0.9 | -0.8 | 0.8 | 3.9 | 2.3 |
| Manufacturing | -0.1 | 0.1 | 1.0 | -0.8 | -0.2 | 2.3 | 2.0 |
| Durable Goods | -0.5 | -0.4 | 2.2 | -0.8 | 0.7 | 3.4 | 2.2 |
| Motor Vehicles | 2.4 | -5.1 | 13.1 | 0.8 | -2.3 | 4.1 | 0.0 |
| Selected High Tech | 0.8 | 1.1 | 2.3 | 8.9 | 5.3 | 6.4 | 2.6 |
| Nondurable Goods | 0.3 | 0.5 | -0.1 | -0.6 | -0.7 | 1.9 | 1.9 |
| Utilities | -4.0 | -6.2 | 2.1 | -6.2 | -1.0 | 4.4 | -0.8 |
| Mining | 1.2 | 1.5 | -0.5 | 3.1 | 7.1 | 12.4 | 7.4 |
| Capacity Utilization (%) | 76.8 | 77.1 | 77.5 | 79.0 | 77.8 | 78.7 | 76.5 |
| Manufacturing | 75.1 | 75.2 | 75.2 | 76.7 | 75.6 | 76.6 | 75.1 |
Gerald D. Cohen
AuthorMore in Author Profile »Gerald Cohen provides strategic vision and leadership of the translational economic research and policy initiatives at the Kenan Institute of Private Enterprise.
He has worked in both the public and private sectors focusing on the intersection between financial markets and economic fundamentals. He was a Senior Economist at Haver Analytics from January 2019 to February 2021. During the Obama Administration Gerald was Deputy Assistant Secretary for Macroeconomic Analysis at the U.S. Department of Treasury where he helped formulate and evaluate the impact of policy proposals on the U.S. economy. Prior to Treasury, he co-managed a global macro fund at Ziff Brothers Investments.
Gerald holds a bachelor’s of science from the Massachusetts Institute of Technology and a Ph.D. in Economics from Harvard University and is a contributing author to 30-Second Money as well as a co-author of Political Cycles and the Macroeconomy.
More Economy in Brief
 Global| Feb 05 2026
Charts of the Week: Balanced Policy, Resilient Data and AI Narratives
by:Andrew Cates


