 Global| May 15 2006
A Bad Week for Domestic and International Stock Markets
Summary
Stock markets around the world began to falter last week and continued to do so this morning. Both developed and emerging markets are succumbing to rising interest rates, the falling dollar and most recently signs of overshooting in [...]

Stock markets around the world began to falter last week and continued to do so this morning. Both developed and emerging markets are succumbing to rising interest rates, the falling dollar and most recently signs of overshooting in commodity prices.
Morgan Stanley International Capital (MSCI) computes stock market indexes and returns on stock market investments for a wide range of individual countries and various aggregates. Among the latter are a world index, regional indexes, EAFE, (includes the developed markets of western Europe and Japan, Hong Kong, Singapore, Australia and New Zealand) and Emerging Markets, among others. The data are available on a daily, weekly and monthly bases in the Haver databases, MSCID, MSCIW, MSCIM.
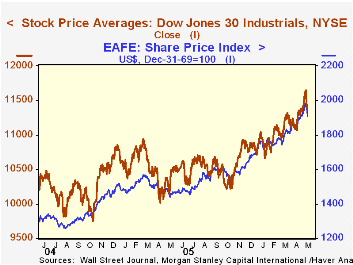
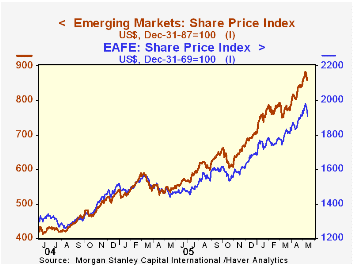
The Dow Jones declined 1.76% from Monday, May 8th to Friday May 12th. The (MSCI) EAFE index declined 1.61% in the same period and MSCI's emerging market index fell 2.79%. The first chart shows the recent down turn in the Dow Jones Index and in MSCI's EFAE index. The second chart compares the trends in MSCI's EAFE and Emerging markets indexes.
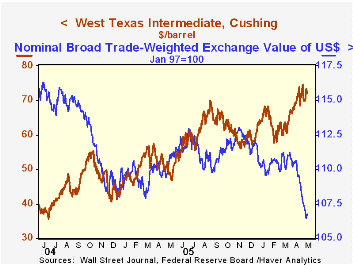
Haver Analytic's DAILY and WEEKLY databases of interest rates, commodity prices, and exchange rates provide much of the data needed to monitor the short term data that may affect stock markets. In the third chart we show the trade weighted value of the U. S Dollar and the price of oil as two of the many factors that may affect stock prices. The rise in oil prices generally has a dampening effect on domestic and foreign stock markets. The impact of a decline in the dollar may be mixed. As far as the US market is concerned it could be positive, but foreign markets are likely to view a decline in the dollar as a negative since it will make their exports less competitive.
| May 12 | May 11 | May 10 | May 9 | May 8 | % Change | |
|---|---|---|---|---|---|---|
| Dow Jones | 11380 | 11501 | 11643 | 11640 | 11584 | -1.76 |
| MSCI EAFE (12/31/69=1000 | 1938.7 | 1966.8 | 1973.1 | 1966.82 | 1970.5 | -1.61 |
| MSCI Emerging Mkts (12/31/87=100) | 856.9 | 873.3 | 879.9 | 881.2 | 881.5 | -2.79 |
| Trade Weighted Dollar (Jan 97=100) | 106.73 | 106.43 | 106.51 | 06.85 | 107.85 | -0.23 |
| Price of Oil Brent Crude ($ per barrel) | 71.49 | 72.30 | 69.74 | 70.66 | 68.83 | 3.86 |
More Economy in Brief
 Global| Feb 05 2026
Charts of the Week: Balanced Policy, Resilient Data and AI Narratives
by:Andrew Cates


