 Global| Mar 25 2019
A Booming US Economy – When Looking in the Rearview Mirror
Summary
I keep hearing that the US economy is booming. After all, in the first quarter of this year, real GDP increased at an annual rate of 3.1% vs. Q4:2018 and 3.2% vs. Q1:2018. Given that our labor force has grown at only 0.8% compounded [...]
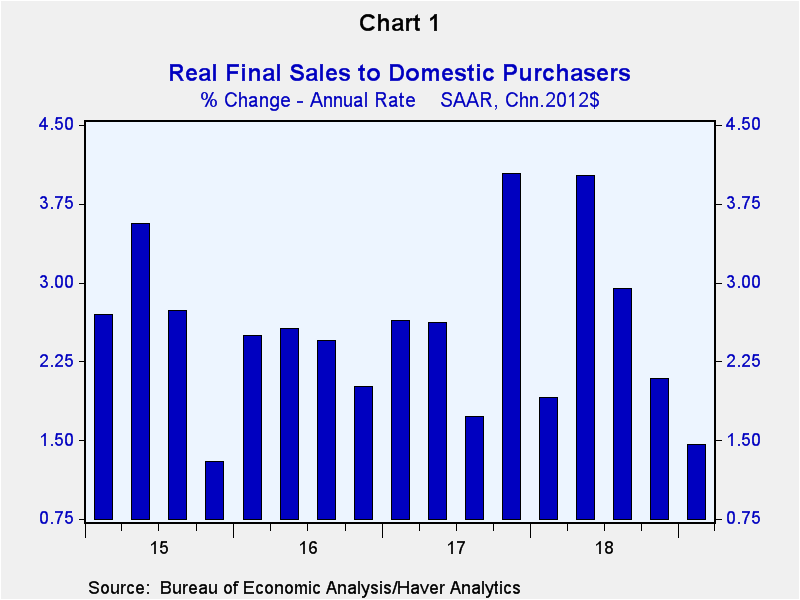
I keep hearing that the US economy is booming. After all, in the first quarter of this year, real GDP increased at an annual rate of 3.1% vs. Q4:2018 and 3.2% vs. Q1:2018. Given that our labor force has grown at only 0.8% compounded annually in the five years ended 2018, 3.2% year-over-year growth in real GDP is impressive. But when I look “under the hood” of the U.S. economy and look through the windshield instead of the rearview mirror, I see an economy drifting toward a recession. Let's first look under the GDP hood. Although Q1:2019 real GDP increased an annualized 3.1% quarter-to-quarter, when inventories and exports are stripped out, that is, when real final sales to domestic purchasers are considered, we get a different perspective on the strength of the US economy. As shown in Chart 1, quarter-to-quarter annualized growth in real final sales to domestic purchasers in Q1:2019 slipped to just under 1.5%, the weakest growth since the 1.3% in Q4:2015. Moreover, growth in real final sales to domestic purchasers has been stair-stepping lower in the past three quarters.
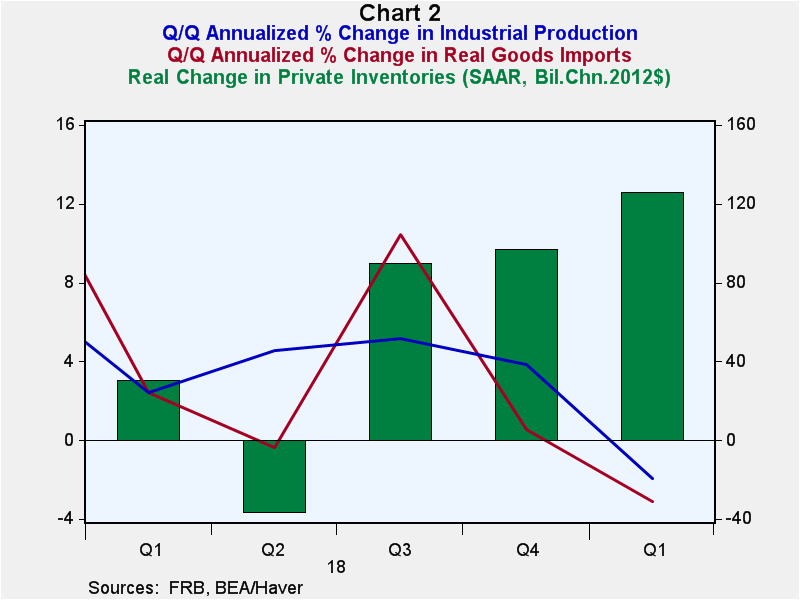
As an aside, I still am at a loss to explain how inventories contributed 0.6% to the 3.1% annualized quarterly change in Q1:2019 real GDP growth. In fact, I still am at a loss to explain how inventories added anything to first quarter real GDP. Inventories are goods that are either produced in the domestic economy and/or are imported from abroad. As shown in Chart 2, both US industrial production (the red line) and US real imports of goods (the blue line) contracted in Q1:2019 while the change in US real private inventories of goods (the green bars) increased. (This mystery regarding the phantom increase in Q1 inventories was called to my attention by Gregg Robb in an April 26, 2019 article on MarketWatch entitled “The big mystery in the GDP report – where did the inventories come from?”) Admittedly, I am not well versed in the intricacies of how the dedicated staff members at the Bureau of Economic Analysis put together GDP estimates. I do not believe that the staff was instructed to “cook the books” of Q1 GDP by a political appointee. The deep state is too deep for this to occur without a leak to the fake media. But enquiring minds want to know.
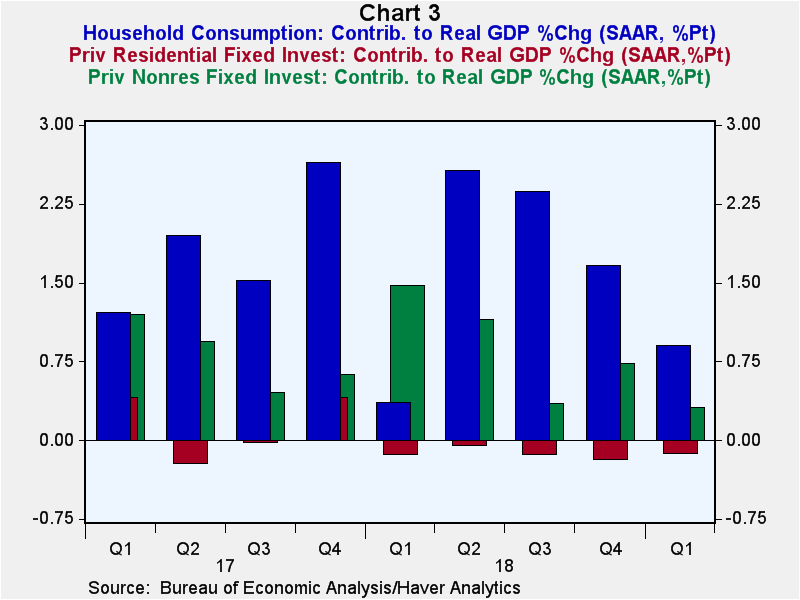
Okay, let's get back under the GDP hood. Chart 3 shows the percentage contributions to real GDP growth by the three private domestic purchasing sectors – household consumption, nonresidential (business) fixed investment and residential investment (housing). All of the “big three” sagged in Q1:2019. The real GDP contribution from household consumer sector has been “stair-stepping” downward starting in Q3:2018. Business investment had its big moment in Q1:2018, perhaps in reaction to the federal cut in the corporate tax rate. But it has been downhill since then. Housing has been a real GDP subtractor in each of the past five quarters. Those phantom inventory builds had better keep coming if the economy is to continue to boom!
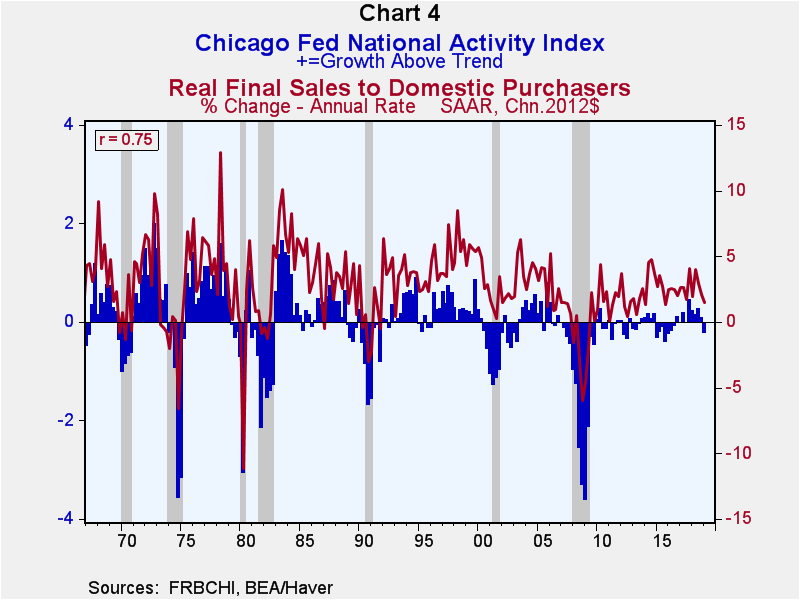
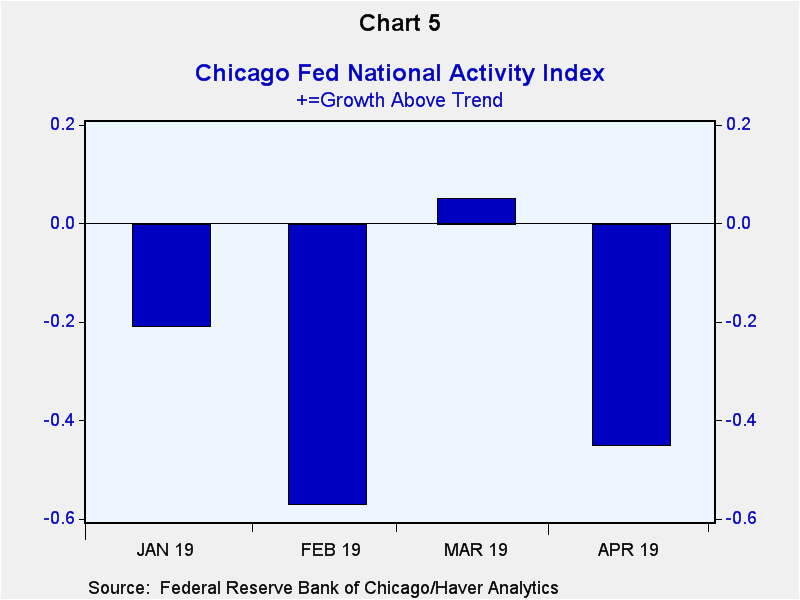
Well, that was a look in the rearview mirror. Let's try to look out the side window to see where the economy was in April. The Chicago Fed National Activity Index (CFNAI) is a handy way to measure the current performance of the US economy. The CFNAI) is The Chicago Fed National Activity Index (CFNAI) is a weighted average of 85 existing monthly indicators of economic activity drawn from four broad categories -- production/income, employment/unemployment/hours, personal consumption/housing and sales/orders/inventories. On a quarterly average basis, the CFNAI has a pretty good track record, a correlation coefficient of 0.76, of tracking quarterly annualized percent changes in real final sales of domestic purchases, as shown in Chart 4. Chart 5 shows that the US economy got off to a shaky start in April according to the CFNAI.
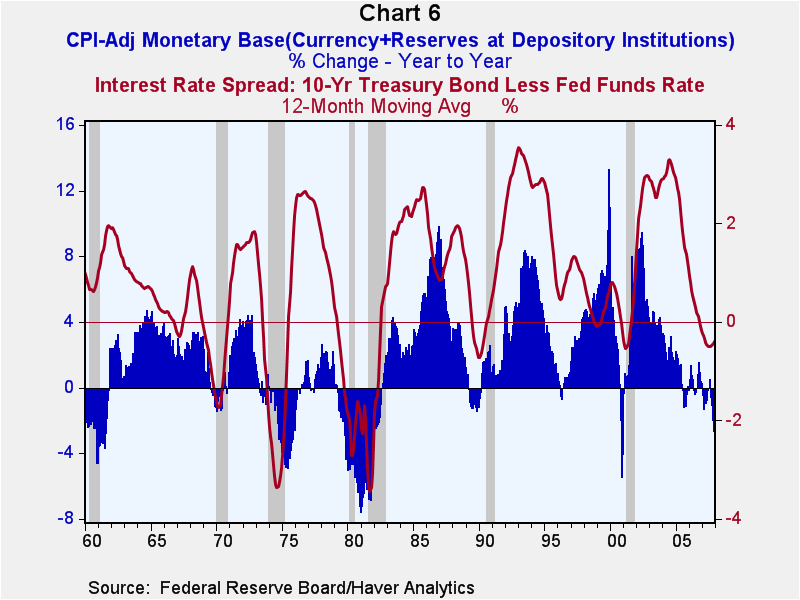
At the outset of this commentary, I said that when I look through the windshield, I see the US economy drifting toward a recession. I base this on the behavior of the Kasriel Recession Warning Index (the KRWI). The KRWI is made up of two variables, the year-over-year percent change in the real (CPI-adjusted) monetary base and the 12-month moving average of the percentage point difference between the yield on the Treasury 10-year security and the federal funds rate. When both of these variables are simultaneously in negative territory, a recession will soon occur. The monthly observations of the KRWI are plotted in Chart 6 from January 1960 through December 2007 with periods of recession demarcated by gray shaded areas. From 1970 through 2008 (not shown in Chart 6) the KRWI performed flawlessly. That is, whenever both elements of the KRWI were simultaneously in negative territory, a recession followed. The KRWI did not signal the 1960 recession. Although the year-over-year percent change in the real monetary base was negative, the yield differential remained positive. So although the KRWI is not infallible, it's not bad for government work. I have tried to come up with a better recession warning index so that I could call it the Second Kasriel Recession Warning Index (SKRWI, sound it out), but I have not been able to improve on it.
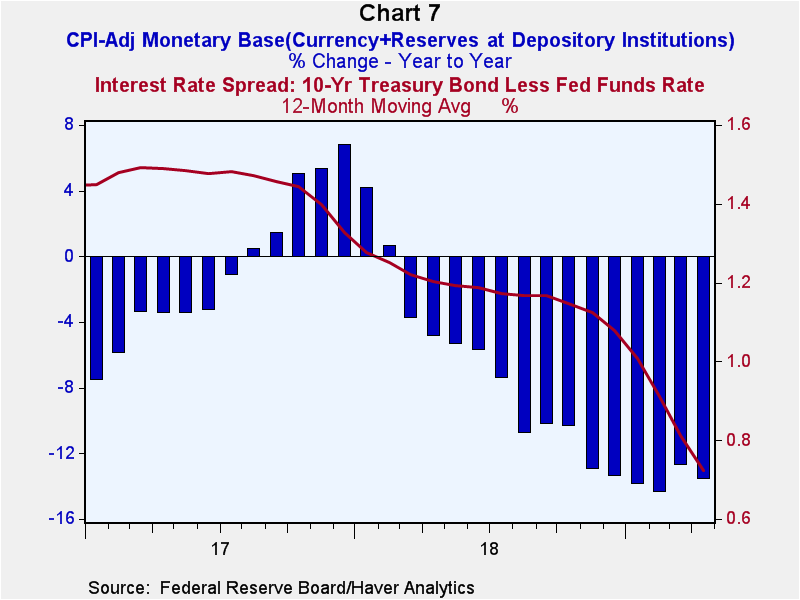 The status of the KRWI through April 2019 is shown in Chart 7. The year-over-year percent changes in the real monetary base have been consistently been in negative territory starting in March 2018. The 12-month moving average in the yield differential between the Treasury 10-year security and the federal funds rate took a decidedly turn down in the waning months of 2018 and stood at 0.72 of a percent in April. As this is being written the yield differential is minus 0.23 of a percent.
In sum, although the US economy might have “booming” in 2018, it has weakened significantly in the first four months of 2019. Moreover, the KRWI suggests that the US economy is slowly drifting toward a recession.
Paul L. Kasriel
AuthorMore in Author Profile »Mr. Kasriel is founder of Econtrarian, LLC, an economic-analysis consulting firm. Paul’s economic commentaries can be read on his blog, The Econtrarian. After 25 years of employment at The Northern Trust Company of Chicago, Paul retired from the chief economist position at the end of April 2012. Prior to joining The Northern Trust Company in August 1986, Paul was on the official staff of the Federal Reserve Bank of Chicago in the economic research department. Paul is a recipient of the annual Lawrence R. Klein award for the most accurate economic forecast over a four-year period among the approximately 50 participants in the Blue Chip Economic Indicators forecast survey. In January 2009, both The Wall Street Journal and Forbes cited Paul as one of the few economists who identified early on the formation of the housing bubble and the economic and financial market havoc that would ensue after the bubble inevitably burst. Under Paul’s leadership, The Northern Trust’s economic website was ranked in the top ten “most interesting” by The Wall Street Journal. Paul is the co-author of a book entitled Seven Indicators That Move Markets (McGraw-Hill, 2002). Paul resides on the beautiful peninsula of Door County, Wisconsin where he sails his salty 1967 Pearson Commander 26, sings in a community choir and struggles to learn how to play the bass guitar (actually the bass ukulele). Paul can be contacted by email at econtrarian@gmail.com or by telephone at 1-920-559-0375.


