 Global| Jan 05 2010
A Double Dip In Singapore's GDP?
Summary
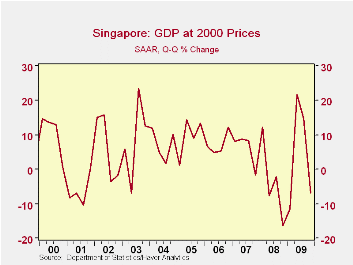
Advanced estimates indicate that Singapore's Gross Domestic Product declined at an annual rate of 6.8% in the fourth quarter, after having risen sharply in the two previous quarters. Such a pattern is not unusual in Singapore's [...]
 Advanced
estimates indicate that Singapore's Gross Domestic Product declined at
an annual rate of 6.8% in the fourth quarter, after having risen
sharply in the two previous quarters. Such a pattern is not
unusual in Singapore's experience, as can be seen in the first
chart, and it does not necessarily suggest that Singapore is
in for another recession. Preliminary data for the
fourth quarter and all of 2009 will be published in
February.
 The
advanced estimates are based largely
on production data for the first two months of the quarter--October and
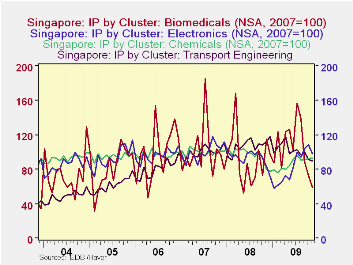
November in this case. In addition to a typical industrial
production index, Singapore produces indexes based on clusters of
production in the chemical, electronic, biomedical, precision
engineering and transport engineering
industries. The second chart shows the
trends in the indexes of the production for four of the five industry
clusters. Movements in the index for the fifth cluster,
Precision Engineering, are shown in the table below.
Production in the chemical and in the precision
engineering clusters increased in October and November.
Production in the electronics cluster increased in October
but fell off in November while production in the transport engineering
declined in both October and November.
 But the biggest change
was the sharp declines in the production of biomedicals, mainly
pharmaceuticals, in both October and November. Production in
the biomedical cluster has been subject to much wider swings than those
of the other clusters and is responsible, in large part, for the
erratic path of the quarterly changes in Singapore's
GDP.
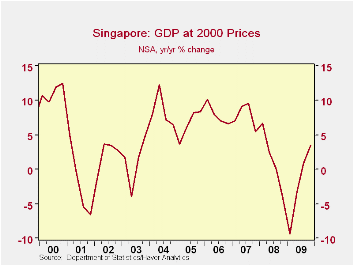
The year to year changes in real GDP are, perhaps, a better indicator of the course of Singapore's economy. These data are shown in the third chart and suggest that Singapore's recovery from recession is continuing.
| Real Gross Domestic Product | Q4 09 | Q3 09 | Q2 09 | Q1 09 | Q4 08 | Q3 08 | Q2 08 | Q1 08 | |
|---|---|---|---|---|---|---|---|---|---|
| M/M Annual Rate of Change in Real GDP (%0 | -6.8 | 14.9 | 21.6 | -11.5 | -16.4 | -2.1 | -7.7 | 12.2 | -- |
| Y/Y Rate of Change (%) | 3.5 | 0.9 | -3.2 | -9.4 | -4.2 | 0.0 | 2.5 | 6.7 | -- |
| Production by Industry Cluster (2007=100) | Nov 09 | Oct 09 | Sep 09 | Aug 09 | Jul 09 | Jun 09 | May 09 | Apr 09 | |
| Electronics | -- | 98.1 | 99.7 | 90.7 | 90.3 | 96.9 | 81.4 | 78.8 | 77.3 |
| Chemicals | -- | 92.6 | 91.2 | 92.9 | 90.2 | 95.9 | 89.4 | 82.9 | 80.6 |
| Biomedical | -- | 53.6 | 77.1 | 90.8 | 133.5 | 146.8 | 106.5 | 132.7 | 131.1 |
| Precision Engineering | -- | 85.4 | 84.7 | 83.0 | 78.6 | 76.8 | 78.8 | 93.8 | 95.7 |
| Transport Engineering | -- | 89.3 | 94.0 | 96.9 | 98.4 | 95.9 | 96.3 | 101.9 | 121.8 |
by Tom Moeller January 5, 2010
 For the
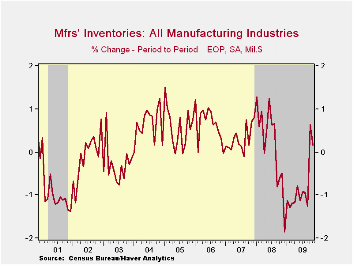
second straight month factory inventories increased, a turn following
thirteen consecutive months of decline. Moreover, October gains were
revised up slightly. The latest monthly increase owed largely to a 3.8%
jump (-26.5% y/y) in auto inventories which was the second consecutive
month of strong gain. That rise was offset by a 1.9% drop (+6.0% y/y)
in defense aircraft and a 0.3% slip (+2.4% y/y) in nondefense aircraft
inventories. Elsewhere, the inventory turn has been limited to the
metals and petroleum industries along with higher prices.
Apparel inventories (-18.6% y/y) continued their decline of more than a year as did machinery inventories (-13.3% y/y), though the latter's decline has slowed significantly. Electrical equipment inventories (-18.9% y/y) also continued to fall but, again, the monthly rates of decline have slowed as they have for computers & electronic products (-9.9% y/y).
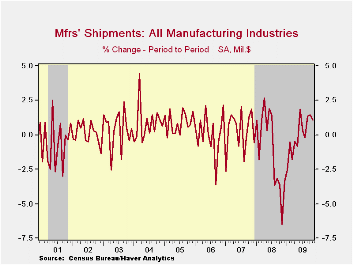
Higher factory shipments are likely to encourage the holding and/or building of inventories. Shipments rose 1.0% during November for the third straight month of strong increase. Shipments of electrical equipment shipments (-9.2% y/y) have been strong for two months as have machinery shipments (-20.3% y/y) for two of the last three. Primary metals (-16.6% y/y) have shown notable monthly increases since May and furniture inventories (-14.5% y/y) also seem to have turned toward accumulation.
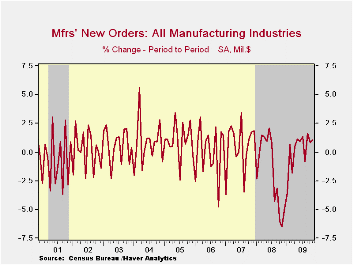
Improved factory new orders are part of the sector's improvement. They rose 1.1% in November, in part reflecting the strength in petroleum prices. A 0.5% monthly increase had been expected. Elsewhere, metals orders (-7.3% y/y) have improved as have orders for machinery (-14.2% y/y) and computers (-2.4% y/y). New orders for electrical equipment & appliances have perhaps turned the most, moving to a 0.7% y/y gain from a 30.5% decline as of June.
The Manufacturers' Shipments, Inventories and Orders (MSIO) data are available in Haver's USECON database.
The Economic Outlook is yesterday's speech by Fed Governor Elizabeth A. Duke and it can be found here.
| Factory Survey (NAICS, %) | November | October | September | Y/Y | 2008 | 2007 | 2006 |
|---|---|---|---|---|---|---|---|
| Inventories | 0.2 | 0.6 | -1.3 | -10.3 | 2.1 | 3.7 | 8.2 |
| Excluding Transportation | 0.3 | 0.5 | -1.0 | -11.8 | -0.6 | 2.7 | 7.9 |
| New Orders | 1.1 | 0.8 | 1.6 | -3.2 | 0.1 | 1.9 | 6.2 |
| Excluding Transportation | 1.9 | 1.0 | 1.5 | -2.1 | 3.1 | 1.2 | 7.4 |
| Shipments | 1.0 | 1.5 | 1.3 | -3.8 | 1.7 | 1.2 | 5.9 |
| Excluding Transportation | 1.3 | 2.2 | 0.6 | -3.6 | 3.7 | 1.5 | 6.7 |
| Unfilled Orders | -0.7 | -0.6 | -0.4 | -10.9 | 3.5 | 17.1 | 15.3 |
| Excluding Transportation | 0.2 | -0.4 | 0.6 | -11.3 | -1.0 | 8.2 | 16.0 |
by Robert Brusca January 5, 2010
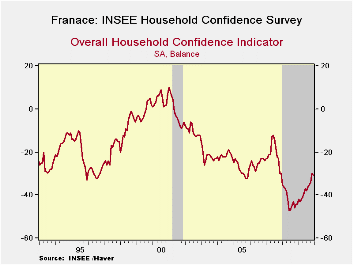
From its low point in mid 2008 France’s Consumer confidence is still making a long slow recovery. Its drop of one point in December does not signal an end to the climb which, although substantial, has only brought the index to the 28th percentile of the range of values it has occupied Since January 1990. By rank the index is in the 15th percentile meaning that 85% of the 240 observations over this period lie above it.
Despite some significant improvement in consumer confidence the indicator remains at a very low point historically. This underlines how severely impacted confidence was as its lows. Since April of 1991 this has been the third strongest string of increases in the index over any sixteen month period, yet the overall measure of confidence remains mired in a low range- reading.
The prospect of unemployment is in the 75th percentile of its range or the 81st by rank implying that French workers infrequently have felt as threatened by unemployment as they are now.
However French respondents mark their current financial situation as improved and as much better than it was over the last 12-months putting it in the top third of its range and the top 11 percent by rank.
French workers put living standards in the bottom 14 percentile of their range over the last 12-months but boost that standing to the 29th percentile (still pretty low) over the next 12 months, in their outlook
On balance the story of the French consumer is still unfolding underpinned by positive trends. The main problem is that conditions had deteriorated so badly and there is a long way to go to get back to normal. This month brought a one-point set back but that hardly seems indicative of a new, more adverse, trend. Progress still appears to be made.
| INSEE Household Monthly Survey | ||||||||||
|---|---|---|---|---|---|---|---|---|---|---|
| Since Jan 1990 | Since Jan 1990 | |||||||||
| Dec 09 |
Nov 09 |
Oct 09 |
Sep 09 |
Percentile | Rank % | Max | Min | Range | Mean | |
| Household Confidence | -31 | -30 | -34 | -35 | 28.1 | 15.0 | 10 | -47 | 57 | -19 |
| Living Standards | ||||||||||
| past 12 Mos | -66 | -66 | -70 | -72 | 14.3 | 13.3 | 18 | -80 | 98 | -40 |
| Next 12-Mos | -37 | -36 | -40 | -41 | 29.3 | 18.8 | 16 | -59 | 75 | -21 |
| Unemployment: Next 12 | 61 | 62 | 65 | 76 | 75.4 | 81.7 | 93 | -37 | 130 | 32 |
| Price Developments | ||||||||||
| Past 12Mo | -26 | -27 | -28 | -34 | 25.6 | 47.9 | 64 | -57 | 121 | -16 |
| Next 12-Mos | -43 | -46 | -46 | -50 | 18.3 | 31.3 | 33 | -60 | 93 | -35 |
| Savings | ||||||||||
| Favorable to save | 11 | 14 | 7 | 4 | 37.8 | 15.8 | 39 | -6 | 45 | 22 |
| Ability to save Next 12 | -6 | -8 | -11 | -14 | 58.6 | 72.5 | 6 | -23 | 29 | -9 |
| Spending | ||||||||||
| Favorable for major purchase | -20 | -19 | -24 | -27 | 37.9 | 37.1 | 16 | -42 | 58 | -14 |
| Financial Situation | ||||||||||
| Current | 17 | 18 | 13 | 13 | 66.7 | 89.6 | 24 | 3 | 21 | 12 |
| Past 12 MOs | -20 | -22 | -24 | -25 | 53.1 | 31.3 | -5 | -37 | 32 | -17 |
| Next 12-Mos | -10 | -8 | -12 | -11 | 40.0 | 15.0 | 11 | -24 | 35 | -2 |
| Number of observations in the period 240 | ||||||||||
by Tom Moeller January 5, 2010
 Evidence of
a U.S. economic recovery has given life to energy prices. The pump
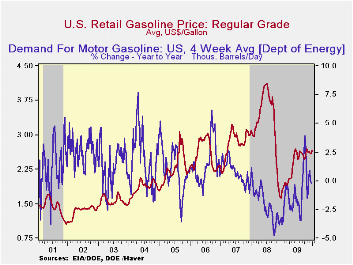
price for regular gasoline rose to $2.67 per gallon last
week, the highest level since early-November. Gasoline prices remain up
from the December '08 low of $1.61. Further strength in prices was
evident yesterday when the spot market price for a gallon of regular
gasoline jumped to $2.10 per gallon from $2.01 the prior week and from
$1.85 at the beginning of December. The figures are reported by the
U.S. Department of Energy and can be found in Haver's WEEKLY
& DAILY databases.
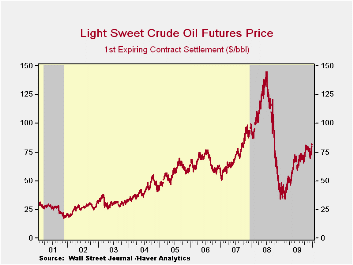
Strength also was evident in the price for a barrel of light sweet crude (WTI) oil. Yesterday, the nearby futures price jumped to $81.51 from $79.07 averaged last week and from $71.53 averaged in early-December. Moreover, prices were up sharply from the December '08 low of $32.37. Inflation May Be the Next Dragon to Slay from the Federal Reserve Bank of St. Louis can be found here .
 Demand for
gasoline leveled off last week and posted a 0.2% decline
versus one year ago. That decline compared to a 3.9% increase at the
beginning of October. Breaking away from earlier y/y strength, the
demand for residual fuel oil fell a sharp 28.6% y/y while distillate
demand fell 8.8% y/y, a decline more moderate than the 21.6% y/y
shortfall at the beginning of last July.
Natural gas prices also strengthened significantly with the winter heating season. Last week prices averaged $5.87 per mmbtu (3.9% y/y), up from the November low of $3.35. Nevertheless, prices remained down by more than half from the high reached in early-July of 2008 of $13.19/mmbtu.
The weekly energy price data can be found in Haver's WEEKLY database while the daily figures are in DAILY. The gasoline demand figures are in OILWKLY.
| Weekly Prices | 01/04/10 | 12/28/09 | 12/21/09 | Y/Y | 2008 | 2007 | 2006 |
|---|---|---|---|---|---|---|---|
| Retail Regular Gasoline ($ per Gallon, Regular) | 2.67 | 2.61 | 2.59 | 58.3% | 3.25 | 2.80 | 2.57 |
| Light Sweet Crude Oil, WTI ($ per bbl.) | 79.14 | 75.09 | 71.77 | 86.2% | 100.16 | 72.25 | 66.12 |
by Tom Moeller January 5, 2010
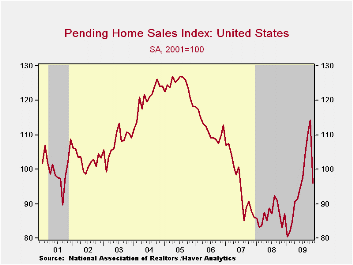 Home sales
suffered during November due to the (since-extended) expiration of an
$8,000 first-time home buyers tax credit. The National Association of
Realtors (NAR) reported that November pending home sales fell 16.0%
from October after nine consecutive months of firm gain. Despite the
m/m decline, sales remained up 19.4% from their January low. The
monthly decline exceeded Consensus expectations for a 3.1% m/m decline.
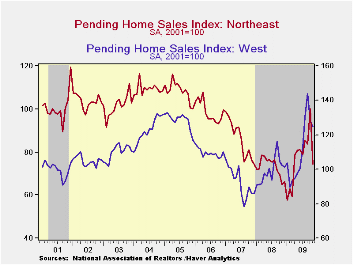 Sales in
the Northeast fell a sharp 25.7% m/m following a 19.9%
October increase. Sales in the Midwest also fell 25.7% but that
followed a lesser 12.3% October gain. Sales in the South fell 15.0%
after the 5.1% October increase while sales in the West fell 2.7% after
a 10.9% October decline.
These home sales figures are analogous to the new home sales data from the Commerce Department in that they measure existing home sales when the sales contract is signed, not at the time the sale is closed. The series dates back to 2001 and the data is available in Haver's PREALTOR database.
Why Are Banks Holding So Many Excess Reserves? from the Federal Reserve Bank of New York is available here .
| Pending Home Sales (2001=100) | November | October | September | Y/Y | 2008 | 2007 | 2006 |
|---|---|---|---|---|---|---|---|
| Total | 96.0 | 114.3 | 110.0 | 15.5% | 86.8 | 95.8 | 112.1 |
| Northeast | 74.4 | 100.2 | 83.6 | 14.8 | 73.1 | 85.9 | 98.9 |
| Midwest | 82.0 | 110.3 | 98.2 | 9.2 | 80.6 | 89.5 | 101.9 |
| South | 97.8 | 115.1 | 109.5 | 14.8 | 89.6 | 107.3 | 127.2 |
| West | 124.6 | 128.1 | 143.8 | 21.4 | 99.5 | 92.3 | 109.6 |
by Tom Moeller January 5, 2010
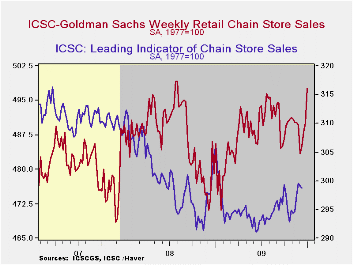
The Holiday spirit, or perhaps after-Christmas discounts, prompted a surge in spending late in 2009. During the latest week, chain store sales jumped 1.5% from the prior week to lift sales to the highest level since August 2008. The late-year surge raised y/y sales growth to 2.5% which was just below the firmest since the middle of 2008.
The ICSC-Goldman Sachs retail chain-store sales index is constructed using the same-store sales (stores open for one year) reported by 78 stores of seven retailers: Dayton Hudson, Federated, Kmart, May, J.C. Penney, Sears and Wal-Mart.
During the last ten years there has been a 69% correlation between the year-to-year growth in chain store sales and the growth in general merchandise retail sales. The weekly figures are available in Haver's SURVEYW database.Perhaps heralding the sales improvement was the leading indicator of chain store sales. It slipped marginally early in December but its level was near the highest since January of last year.
This composite leading economic indicator is compiled from
four series: (1) the MBA's volume index of mortgage applications
for home purchase (2) the ABC News/Money magazine's survey of consumer
buying conditions (3) new filings for jobless benefits and (4) the
30-year government bond yield.
The Current State of the Economy and a Look to the Future (With Reference to William ‘Sidestroke’ Miles, W. Somerset Maugham, Don Ameche and Kenneth Arrow) is the title of yesterday's speech by Dallas Fed Governor Richard W. Fisher and it can be found here.
| ICSC-UBS (SA, 1977=100) | 01/01/10 | 12/25/09 | 12/18/09 | Y/Y | 2009 | 2008 | 2007 |
|---|---|---|---|---|---|---|---|
| Total Weekly Chain Store Sales | 497.6 | 490.1 | 488.1 | 2.5 % | 0.1% | 1.4% | 2.8% |


