 Global| Mar 29 2005
A Group of Disappointing Japanese Economic Indicators for February
Summary
After strong economic data for Japan in January, the latest indicators are disappointing. Retail sales declined by almost 3% from January to February and were only 0.9% above February, 2004. Employment declined 0.4% in February and [...]

After strong economic data for Japan in January, the latest indicators are disappointing. Retail sales declined by almost 3% from January to February and were only 0.9% above February, 2004. Employment declined 0.4% in February and unemployment was up 2.7%, resulting in a 2 percentage point increase in the unemployment rate to 4.7%
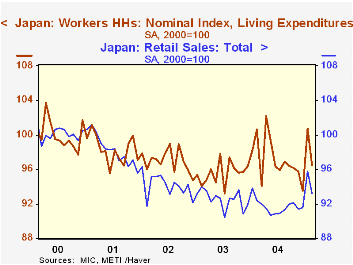
In spite of lower employment, the average worker's household income increased by 4.5% in February and his disposable income was up 5%, suggesting an increase in wages. These data are, however, seasonally unadjusted. The seasonally adjusted index of worker's income actually shows a decline of 0.3%. Such a decline together with concern over employment prospects as a result of the rise in the unemployment rate may have been an important factor causing the average household to reduce living expenditures by almost 9% seasonally unadjusted or 4% seasonally adjusted in the month. The indexes of the worker household's expenditures and the broader retail sales series are shown in the attached chart.
| Feb 05 | Jan 05 | Feb 04 | M/M% | Y/Y% | 2004 % | 2003% | 2002% | |
|---|---|---|---|---|---|---|---|---|
| Employment (10,000) | 6339 | 6357 | 6324 | -0.4 | 0.2 | 0.2 | -0.2 | -1.3 |
| Unemployment (10,000) | 310 | 302 | 332 | 2.6 | -6.6 | -10.6 | -2.4 | 5.5 |
| Retail Sales (2000=1000 | 93.2 | 95.8 | 92.4 | -2.7 | 0.9 | -0.9 | -1.7 | -4.3 |
| Worker's Household | ||||||||
| Income (1000 Yen) | 469.9 | 119.7 | 472.8 | 4.5 | -0.6 | 1.0 | -2.6 | -2.3 |
| Income (2000=1000 | 95.6 | 95.9 | 96.3 | -0.3 | -0.7 | 1.3 | -2.9 | -2.2 |
| Disposable Inc (1000 Yen) | 400.1 | 381.1 | 403.9 | 5.0 | -1.0 | 1.0 | -2.7 | -2.6 |
| Living Expenditures (1000 Yen) | 371.2 | 406.8 | 383.3 | -8.7 | -3.1 | 1.5 | -1.6 | -1.2 |
| Living Expenditures(2000=100) | 96.5 | 100.7 | 100.6 | -4.2 | -4.1 | 1.6 | -1.5 | -1.4 |
More Economy in Brief
 Global| Feb 05 2026
Charts of the Week: Balanced Policy, Resilient Data and AI Narratives
by:Andrew Cates


