 Global| May 11 2010
A Potpourri Of April Data For China
Summary
A number of economic variables in the Chinese economy have been updated for April over the past few days. Although still relatively low, 2.8% in April, the inflation rate based on the Consumer Price Index has been rising steadily. In [...]


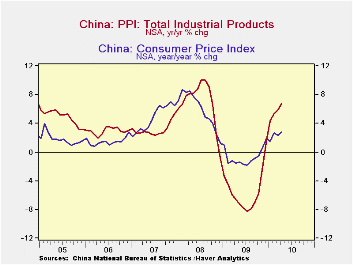
A number of economic variables in the Chinese economy have been updated for April over the past few days. Although still relatively low, 2.8% in April, the inflation rate based on the Consumer Price Index has been rising steadily. In September of last year the Consumer Price index was declining at rate of almost 1% from the previous year. Inflation at the Producer level is considerably higher. In April, the year to year percent change in the Producer Price Index was 6.8%, up from 5.9% in March and from -6.99% in September of last year. The year to year changes in the CPI and PPI are shown in the first chart.
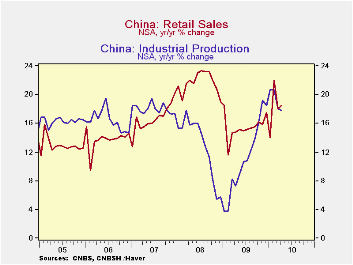
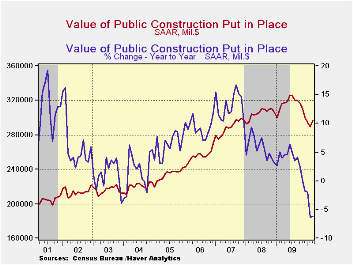
Although the year to year increase in retail trade in April of 18.5%, up from 18.0% in March, did not top February's 22.1% increase, the rate of growth in retail sales continues at relatively high levels historically as can be seen in the second chart. This chart also includes the year to year percent changes in Industrial Production. After an almost uninterrupted increase in the growth of production from January 2009 when the year to year increase was 3.8% to January 2010 when the year to year increase was 20.7% growth appears to be decelerating. In April it was 17.8%. While the year to year percent increases in industrial production have only recently begun to decelerate, the year to year increase in fixed investments has been on a downtrend since mid 2009 as shown in the third chart.
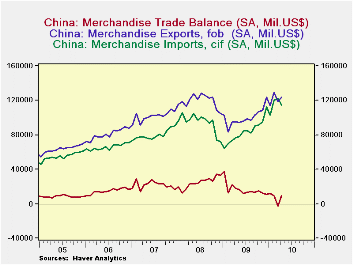
The final piece of information on China's economy recently released concerns the balance of trade in goods. In March, China recorded the first deficit in its balance of trade in goods since February, 2004. Even then a trade deficit for China was unusual. One has to go back to the early nineties to find more than an occasional deficit in China's trade in goods. The deficit was the result of a drop in exports and a surge in imports principally of raw materials. Exports recovered in April and imports declined with the result that a surplus on trade of $9.6 billion US was recorded as can be seen in the fourth chart.


| CHINA | Apr 10 | Mar 10 | Feb 10 | Jan 10 | Dec 09 | Nov 09 | Oct 09 | Sep 09 |
|---|---|---|---|---|---|---|---|---|
| Producer Price Index (Y/Y % chg) | 6.80 | 5.90 | 5.40 | 4.30 | 1.70 | -2.08 | -5.80 | -6.99 |
| Consumer Price Index (Y/Y % chg) | 2.8 | 2.4 | 2.7 | 1.5 | 1.9 | 0.6 | -0.5 | -0.8 |
| Retail Trade (Y/Y % chg) | 18.5 | 18.0 | 22.1 | 14.0 | 12.5 | 15.8 | 16.2 | 15.5 |
| Industrial Production (Y/Y % chg) | 17.80 | 18.10 | 20.69 | 20.69 | 18.50 | 19.20 | 16.10 | 13.90 |
| Investment in Fixed Assets (Y/Y % chg) | 26.1 | 26.4 | 26.6 | 28.6 | 30.5 | 32.1 | 33.1 | 33.3 |
| Balance of Trade in Goods (Bil US$) | 9.6 | -3.1 | 9.6 | 12.0 | 10.7 | 12.5 | 14.7 | 13.5 |
| Exports of Goods (Bil US$) | 123.9 | 118.7 | 129.6 | 114.2 | 123.3 | 107.9 | 106.2 | 103.7 |
| Imports of Goods (Bil US$) | 114.3 | 121.8 | 120.0 | 102.2 | 112.6 | 95.4 | 91.5 | 90.2 |
More Economy in Brief
 Global| Feb 05 2026
Charts of the Week: Balanced Policy, Resilient Data and AI Narratives
by:Andrew Cates


