 Global| Jul 25 2005
A Smaller Trade Deficit for Mexico in June
Summary
Mexico's trade deficit improved in June to -$270.6 million from -$579.7 million in May and was $526.6 million better than June, 2004. As a developing country, Mexico typically runs a trade deficit, which is offset by a capital inflow. [...]

Mexico's trade deficit improved in June to -$270.6 million from -$579.7 million in May and was $526.6 million better than June, 2004. As a developing country, Mexico typically runs a trade deficit, which is offset by a capital inflow. The improvement in the balance was due to a 0.7% rise in exports and a 0.2% decline in imports.
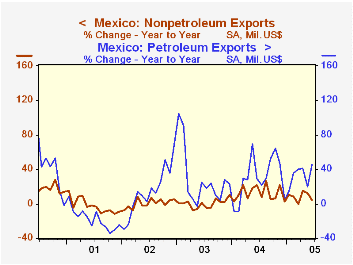
Exports were up 0.7% from May to June and were 13.0% above the year ago figure. Petroleum exports were up 11.0% for the month and 45.6% for the year. Higher prices, no doubt, accounted for much of the rises in petroleum. Non petroleum exports declined 1.6% in June, but were almost 5% above the year ago figures. The year-to-year changes in non petroleum exports have tended to be much smaller than the swings in the year-to-year changes in petroleum exports as shown in the first chart.
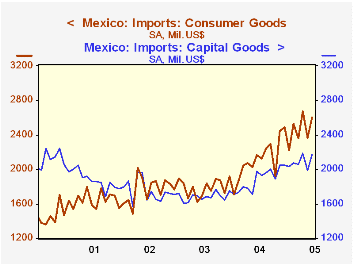
Imports decreased by 0.2% in June from May but were still 8.4% above June, 2004. The bulk of Mexico's imports consists of intermediate goods for further assembly and processing.These goods declined 4.1% from May to June, but were 3.3% above the June 2004. Over the past five years they have accounted for between 70% and 80% of total imports.The relative importance of capital and consumer goods has been changing in recent years with consumer goods rising in importance relative to capital goods, as shown in the second chart.
| Mexico Million US Dollars |
Jun 05 | May 05 | Jun 04 | M/M % | Y/Y % | 2004 | 2003 | 2002 |
|---|---|---|---|---|---|---|---|---|
| Exports | 17618.4 | 17503.1 | 15591.8 | 0.66 | 13.0 | 187475 | 164868 | 160899 |
| Petroleum | 2661.1 | 2397.0 | 1828.2 | 11.02 | 45.56 | 23656 | 18623 | 14853 |
| Non Petroleum | 15124.2 | 15368.1 | 14421.3 | -1.59 | 4.89 | 164404 | 146262 | 146278 |
| Imports | 17823.8 | 17851.2 | 16437.0 | -0.15 | 8.42 | 195825 | 170576 | 168482 |
| Consumer Goods | 2597.5 | 2366.2 | 2163.9 | 9.78 | 20.04 | 25402 | 21509 | 21178 |
| Capital Goods | 2174.5 | 1995.0 | 1977.6 | 9.55 | 9.96 | 22597 | 20205 | 20992 |
| Intermediate Goods | 13373.1 | 13940.1 | 12949.3 | -4.07 | 3.27 | 148813 | 128831 | 126508 |
| M/M chg | Y/Y chg | |||||||
| Trade Balance | -270.6 | -579.7 | -797.2 | 109.1 | 526.6 | -8724 | -5710 | -7538.6 |
More Economy in Brief
 Global| Feb 05 2026
Charts of the Week: Balanced Policy, Resilient Data and AI Narratives
by:Andrew Cates


