 Global| Feb 21 2006
A Stunning Rise in French New Industrial Orders: Better GDP Growth Ahead?
Summary
French real Gross Domestic Product rose only 0.2% in the fourth quarter of 2005 over the third quarter. For the year, GDP was up 1.4%. A growing deficit on foreign trade continued to offset modest gains in domestic demand, that is, [...]

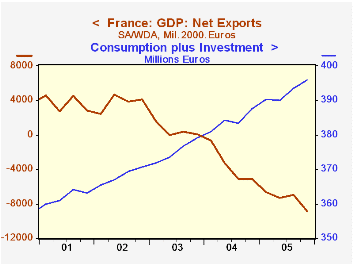
French real Gross Domestic Product rose only 0.2% in the fourth quarter of 2005 over the third quarter. For the year, GDP was up 1.4%. A growing deficit on foreign trade continued to offset modest gains in domestic demand, that is, consumption plus investment as shown in the first chart.
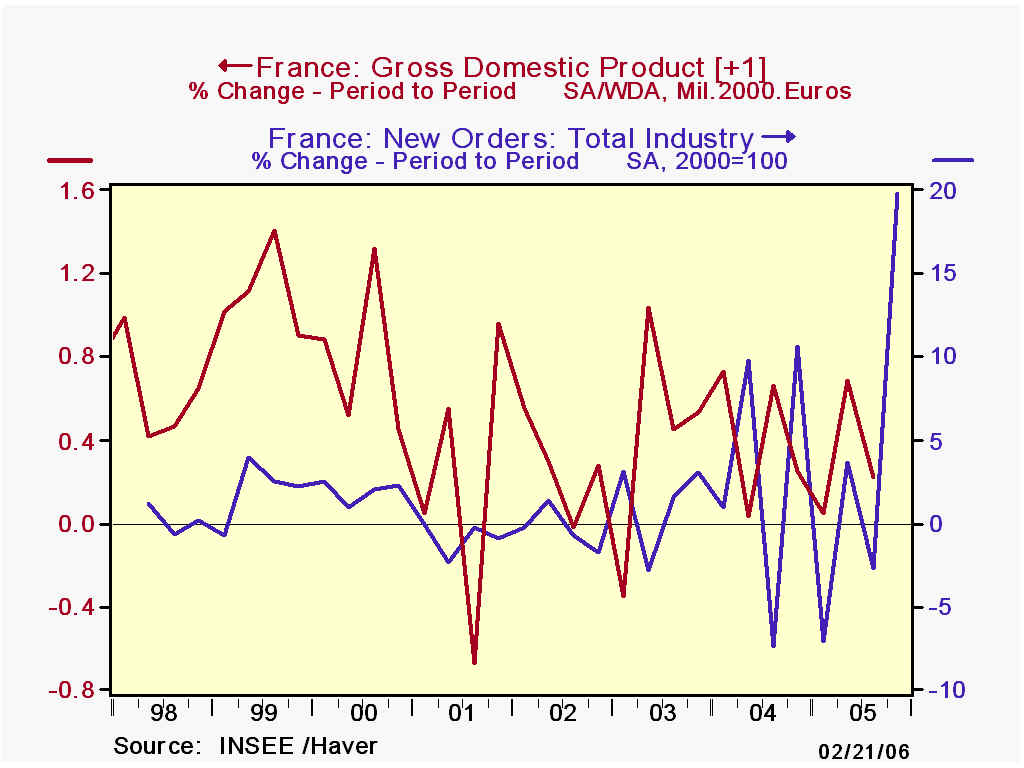
A stunning increase in new industrial orders in the fourth quarter of 2005, suggests that GDP growth in the current quarter could surprise on the upside. While new industrial orders are only a small part of the total economy, they are an important catalyst for future growth. There is a loose relationship between the change in new industrial orders and the change in real GDP one quarter later, as shown in the second chart. (We have aggregated the new industrial order series on a quarterly basis to facilitate comparison with GDP movements.)
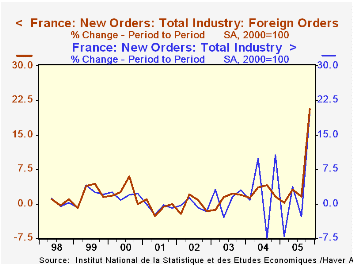
Total new orders increased 19.7% in the fourth quarter of 2005, the largest quarterly increase recorded since the series first began in 1998. Most of the rise was due to a big jump in foreign new orders which rose 20.5% in the quarter. This too was a record increase. Changes in total and foreign new orders are shown in the third chart, which covers the entire period for which the data are available.
| France: GDP and New Industrial Orders | Q4 05 | Q3 05 | Q4 045 | Q/Q % | Y/Y % | 2005 | 2004 | 2003 |
|---|---|---|---|---|---|---|---|---|
| GDP (Bil. 2000 Euros) | 391.2 | 390.4 | 386.5 | 0.2 | 1.2 | 1,556.8 | 1,535.4 | 1,504.6 |
| Total Consumption | 318.4 | 316.7 | 312.8 | 0.6 | 1.8 | 1,263.2 | 1,239.5 | 1,210.7 |
| Total Fixed Investment | 77.4 | 76.9 | 74.9 | 0.6 | 3.3 | 306.5 | 296.7 | 290.6 |
| Consumption+Investment | 395.9 | 393.6 | 387.7 | 0.6 | 2.1 | 1,569.8 | 1,536.2 | 1,501.2 |
| Net Export of Goods & Service | -8.9 | -7.0 | -5.1 | -1.9* | -3.8* | -29.8 | -14.1 | 2.0 |
| New Industrial Orders (2000=100) | ||||||||
| Total | 130.8 | 109.2 | 116.5 | 19.7 | 12.2 | 115.2 | 109.8 | 100.4 |
| Foreign | 146.6 | 121.6 | 115.8 | 20.5 | 26.6 | 125.9 | 111.3 | 101.6 |


