 Global| Jun 26 2006
ĀBusiness Confidence Strengthens in BelgiumĀ But Weakens in FranceĀĀ
Summary
European measures of confidence for June are beginning to appear. Last Friday Belgium reported a surprisingly large increase in business confidence. The National Bank of Belgium's overall gross synthetic indicator of business [...]

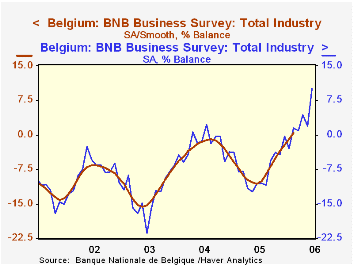
European measures of confidence for June are beginning to appear. Last Friday Belgium reported a surprisingly large increase in business confidence. The National Bank of Belgium's overall gross synthetic indicator of business confidence rose 8.1 point from May to June and reached 10.2%, the highest value on record since the series began in January, 1980. The Bank also calculates a smoothed series, excluding outliers, that reflects the underlying trend of confidence. The smoothed series is only available after a delay of three to four months. Both the current indicator and the smoothed series are shown in the first chart. The continued rise in the current indicator suggests that the underlying trend in consumer confidence is still positive.
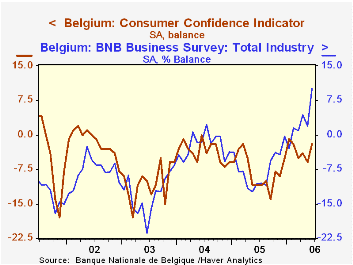
Consumers in Belgium are less confident than the business community. While they have shown a small increase in confidence recently, it has been more a case of a decline in the excess of pessimists over optimists.In June, the consumer indicator of confidence was -2% compared with -6% in May and -11% in June, 2005. Chart 2 compares the Belgian consumer and business confidence indicators.
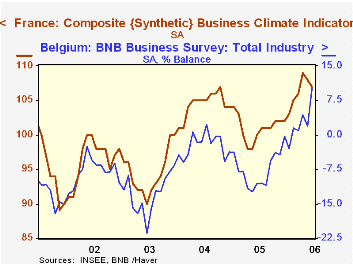
In contrast to Belgium, business confidence in France has been slipping since April when a recent peak of 109 was reached. Confidence measured 107 in June, down almost 1% from 108 in May, but up 7% since June, 2005. Chart 3 compares the measures of business confidence in France and Belgium. While the levels of confidence are not comparable, the trends in the two series can be compared. Until recently business confidence in France has tended to follow the same ups and downs as business confidence in Belgium. Since April, the trends have diverged. (The Belgian series is expressed as a percent balance between optimists and pessimists while the French series has been constructed so that it has an average of 100 and a standard deviation of 10.)
| Measures of Confidence | Jun 06 | May 06 | Jun 05 | M/M | Y/Y | 2005 | 2004 | 2003 |
|---|---|---|---|---|---|---|---|---|
| Belgium | ||||||||
| Business Confidence (%) | 10.1 | 2.0 | -10.7 | 8.1 | 20.8 | -7.5. | -2.3 | -12.9 |
| Consumer Confidence(%) | -2 | -6 | -11 | 4 | 9 | -8 | 4 | -11 |
| France | ||||||||
| Business Confidence (Average=100) | 107 | 108 | 100 | -0.93 | 7.00 | 101 | 104 | 95 |


