 Global| Mar 07 2007
ADP Report Points to 57K Private Payroll Growth for February; Survey Revised, Series Added on Sector and Firm-Size
Summary
The ADP National Employment Report for February points to a 57,000 increase in private nonfarm payrolls. This measure is intended as a leading indicator for the "official" BLS data to be reported Friday, March 9. For January, the ADP [...]
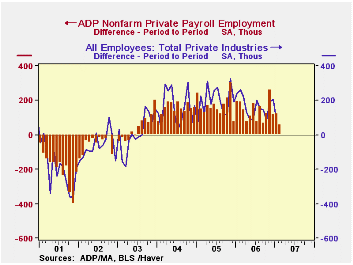
The ADP National Employment Report for February points to a 57,000 increase in private nonfarm payrolls. This measure is intended as a leading indicator for the "official" BLS data to be reported Friday, March 9. For January, the ADP figure was 121,000, with the actual coming at 97,000. 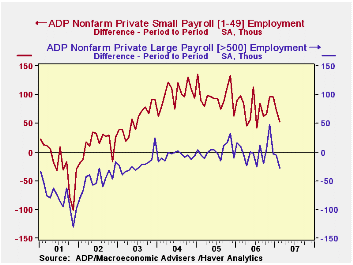
With the annual revision of the BLS data, ADP has also revised its figures and made methodological changes in the calculations. ADP, you perhaps know, processes payrolls for millions of American workers; indeed, their annual report says they cover 1 in 6 private sector workers. Initially their calculation was based on a sample of their own clients covering about 7 million workers. They have expanded this to a substantial portion of their entire base, with data collection weekly not just once a month. New efforts are being made to align both the totals and a broad industry breakdown every month. The seasonal adjustment process was shifted from X-11 to X-12 ARIMA, and closer examination is being made for outliers. These changes are aimed at minimizing the production of false signals in the report: for example, in December, the original series pointed to a decline in private sector jobs of 40,000, but the BLS figure showed an increase of 150,000.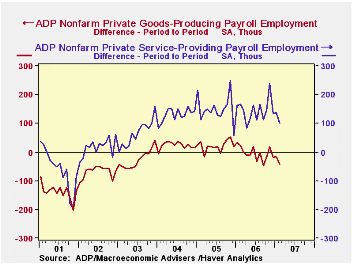
The Report also contains new information. It shows a breakdown for goods-producing and service-producing sectors, with employment in goods industries presently seen declining 43,000 in February and services going up 100,000. Brand-new series are available on the size of payroll units. Since most business growth has occurred in small- and medium-sized firms, this would be useful in assessing the breadth of payroll changes. So for February, the ADP data show a 53,000 gain at small businesses (49 or fewer employees), 33,000 at medium-sized companies (50-499) and a decline of 29,000 at large firms (500 and over). It's easy to focus on large businesses because they get more public attention, but in fact, it's the smaller ones where there is more dynamism.
| Private Nonfarm Payrolls (000s) | Feb 2007 | Jan 2007 | Dec 2006 | Nov 2006 | Monthly Averages|||
|---|---|---|---|---|---|---|---|
| 2006 | 2005 | 2004 | |||||
| ADP Total | 115,111 | 115,054 | 114,933 | 114,815 | 114,165 | 112,288 | 110,290 |
| Change | 57 | 121 | 118 | 258 | 142 | 171 | 153 |
| BLS Total | -- | 115137 | 115040 | 114835 | 114186 | 111890 | 109804 |
| Change | -- | 97 | 205 | 190 | 167 | 198 | 159 |
by Carol Stone March 7, 2007
Yesterday, we wrote here about the sharp increases in hourly compensation and unit labor costs now seen in the productivity data for Q4. Compensation rose at an 8.2% annual rate, pushing unit labor costs up at a 6.6% pace. We mentioned that these big moves were the result of unusually large bonuses in Q4.
However, the personal income data show these bonuses -- said by the BLS to be $50 billion -- in January, not during Q4. How do these factors jibe?
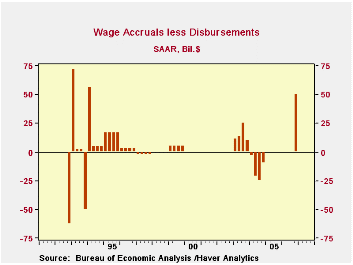
The secret is a little noticed item in the National Income Accounts called "Wage Accruals less Disbursements", which is usually 0. Businesses record wages as they are accrued, but workers receive wages when they are actually disbursed. Normally, these are simultaneous actions. So the clue that compensation would be raised sharply in the productivity revisions was visible to analysts who looked carefully at Table 1.10 in the National Income Accounts at that series "Wage Accruals less Disbursements". In the GDP revisions released on February 28, this series was changed to $50 billion from the 0 originally reported. We'd expect that to reverse in Q1 as wage disbursements will have been larger than accruals. 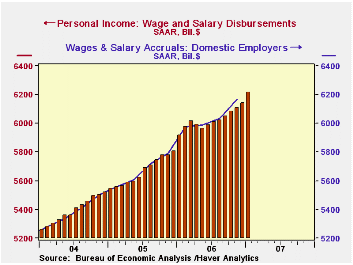
Bonuses, of course, had been paid in early 2006 as well, but these were evidently also accounted for by businesses in Q1 2006, not late 2005. So compensation and unit labor cost in the productivity data moved simultaneously in Q1 with the income reported in the personal income data.
Another instructive example of the same kind of phenomenon occurred in 1992 and 1993. Tax rates were expected to be raised early in the new presidential administration, so disbursement of some compensation was accelerated into 1992 to capture it under the old tax rates. This meant that disbursements were larger than accruals, and the series "wage accruals less disbursements" was therefore negative, -$63.0 billion, followed by a commensurate positive offset in early 1993. In this instance, businesses' accrued labor costs were not affected, so compensation in the productivity data continued along a relatively smooth path, despite the whipsaw in compensation -- up in Q4 1992 and down in Q1 1993 -- in the personal income data.
[We thank some colleagues in the New York Association for Business Economics for pointing out the application of accruals less disbursements. In the Haver data offerings, the Wage Accruals less Disbursements series is in the USNA database, and the productivity data are in USECON.]
Carol Stone, CBE
AuthorMore in Author Profile »Carol Stone, CBE came to Haver Analytics in 2003 following more than 35 years as a financial market economist at major Wall Street financial institutions, most especially Merrill Lynch and Nomura Securities. She had broad experience in analysis and forecasting of flow-of-funds accounts, the federal budget and Federal Reserve operations. At Nomura Securities, among other duties, she developed various indicator forecasting tools and edited a daily global publication produced in London and New York for readers in Tokyo. At Haver Analytics, Carol was a member of the Research Department, aiding database managers with research and documentation efforts, as well as posting commentary on select economic reports. In addition, she conducted Ways-of-the-World, a blog on economic issues for an Episcopal-Church-affiliated website, The Geranium Farm. During her career, Carol served as an officer of the Money Marketeers and the Downtown Economists Club. She had a PhD from NYU's Stern School of Business. She lived in Brooklyn, New York, and had a weekend home on Long Island.
More Economy in Brief
 Global| Feb 05 2026
Charts of the Week: Balanced Policy, Resilient Data and AI Narratives
by:Andrew Cates


