 Global| Apr 11 2005
Advance Estimate of Singapore's Y/Y Growth of GDP in Q1 Implies a Big Decline in Q/Q Seasonally Adjusted Annual Rate
Summary
The advance estimate for the year to year growth in Singapore's first quarter seasonally unadjusted Gross Domestic Product was 2.4%, down from 6.5% in the fourth quarter of 2004 and was well below the average growth for all of 2004 at [...]

The advance estimate for the year to year growth in Singapore's first quarter seasonally unadjusted Gross Domestic Product was 2.4%, down from 6.5% in the fourth quarter of 2004 and was well below the average growth for all of 2004 at 7.5%. The manufacturing sector was up 3.0%, compared with an increase of 14.1% in the fourth quarter of 2004. Construction continued to decline but the first quarter decline of 6.5% was smaller that that of the 8.4% decline in the fourth quarter of 2004. The service sector showed a 3.5% increase compared with 4.8% in the previous quarter.
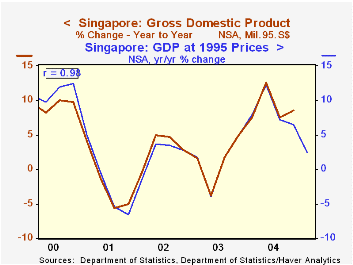
The advance estimates published by the Ministry of Trade and Industry, based largely on data from the first two months of the quarter, are intended as an early indicator of GDP growth and are subject to revision as more comprehensive data become available. The advance estimates are, however, a good indicator of the actual results as can be seen in the first chart that compares the advance estimates with the actual results.
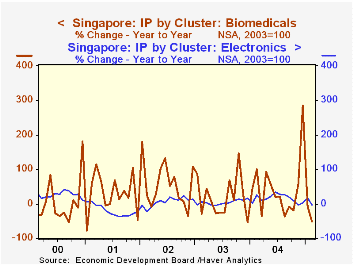
Although the first quarter GDP was 2.4% above the first quarter of 2004, the Ministry of Trade and Industry noted that on a seasonally adjusted annual rate basis, GDP in the first quarter declined by 5.8% from the fourth quarter of 2004, which had been 7.9% above the third quarter. Part of the wide swing from growth of 7.9% to a decline of 5.8% can be attributed to production in the Biomedical sector which includes the volatile pharmaceutical industry. The second chart compares the production indexes for the biomedical and electronics industries and shows that the volatility of the biomedical sector is far greater even than that of the electronics industry, which itself is noted for its wide swings.
| Singapore: Gross Domestic Product | Q1 05 | Q4 04 | Q3 04 | Q2 04 | Q1 04 | 2004 | 2003 | 2002 |
|---|---|---|---|---|---|---|---|---|
| Y/Y Advance Estimates % | ||||||||
| Total | 2.4 | 6.5 | 7.2 | 12.3 | 7.9 | 8.5 | 1.1 | 2.2 |
| Manufacturing | 3.0 | 14.1 | 11.2 | 20.1 | 10.2 | 13.9 | 3.0 | 8.0 |
| Construction | -6.5 | -8.4 | -11.4 | -6.4 | 1.0 | -6.3 | -10.7 | -10.8 |
| Services | 3.5 | 4.8 | 6.9 | 11.4 | 7.2 | 7.6 | 1.0 | 1.4 |
| Q/Q SA annual rate % | -5.8 | 7.9 | 0.7 | 7.5 | 10.1 | 8.5 | 1.1 | 2.2 |
| Manufacturing Production 2003=100 | Feb 05 | Jan 05 | Feb 04 | M/M | Y/Y | 2004 | 2003 | 2002 |
| Biomedical | 53.4 | 102.1 | 111.3 | -67.1 | -52.0 | 25.7 | 10.8 | 43.0 |
| Pharmaceutical | 42.3 | 173.7 | 116.1 | -75.6 | -63.6 | 29.8 | 13.4 | 48.6 |
| Electronics | 97.9 | 110.0 | 100.3 | -11.0 | -2.4 | 14.8 | 4.5 | 5.2 |
| Chemicals and Products | 101.4 | 114.6 | 100.3 | -11.5 | 1.1 | 7.9 | 6.5 | 11.1 |
| Precision Equipment | 86.6 | 102.6 | 99.8 | -15.6 | -13.2 | 7.8 | -0.7 | 2.0 |
| Transport Equipment | 128.6 | 130.4 | 101.3 | -1.4 | 27.0 | 24.0 | -6.0 | 8.9 |
More Economy in Brief
 Global| Feb 05 2026
Charts of the Week: Balanced Policy, Resilient Data and AI Narratives
by:Andrew Cates


