 Global| Sep 10 2007
ĀJapan's Revised Q2 GDP Declines 1.2% (SAAR): ĀEconomy Watchers Wary ĀĀ
Summary
Revised data for Japan's second quarter GDP revealed a 1.2% seasonally adjusted rate of decline, in contrast to a 0.5% increase estimated earlier and a consensus of a 0.7% decline. The main culprit in the decline was a sharp drop in [...]

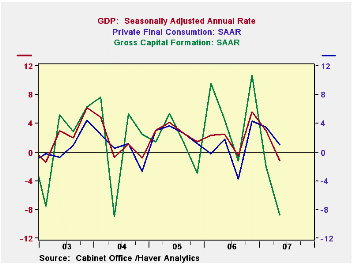
Revised data for Japan's second quarter GDP revealed a 1.2% seasonally adjusted rate of decline, in contrast to a 0.5% increase estimated earlier and a consensus of a 0.7% decline. The main culprit in the decline was a sharp drop in gross capital formation, which declined at a seasonally adjusted annual rate of almost 7%. Inventories also declined. While final private consumption increased, the annual rate of increase was smaller than in the first quarter. The first chart shows the annual rates of change for total GDP, private consumption and gross fixed capital formation.
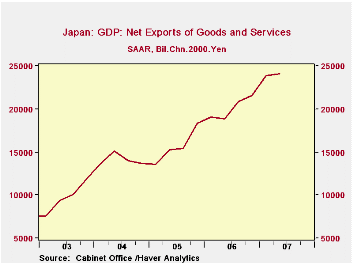
Although small, the second quarter increase in the net exports of good and services resulted in a record 24.1 trillion 2000 chained yen as shown in the second chart.
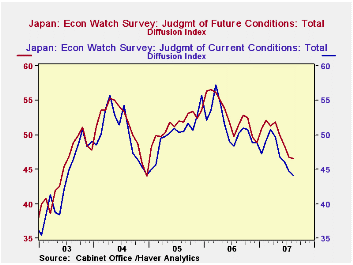
The decline in Japan's second quarter GDP preceded the financial turmoil which has roiled world stock markets and cast doubts on world economic growth. The Japanese are now reappraising their outlook for the rest of the year. The August Economy Watchers Survey released today is not encouraging. The diffusion indexes regarding current and future conditions continue to decline, as shown in the third chart.

| JAPAN: Gross Domestic Product (Trillion 2000 Chained Yen) |
Q2 2007 | Q1 2007 | Q2 2006 | Q/Q SAAR | Y/Y Chg | 2006 | 2005 | 2004 |
|---|---|---|---|---|---|---|---|---|
| Total | 557.4 | 539.1 | 548.2 | -1.21 | 1.67 | 549.0 | 537.2 | 527.3 |
| Private Consumption | 308.9 | 308.2 | 305.2 | 1.01 | 1.22 | 304.3 | 301.7 | 297.1 |
| Gross Fixed Capital Formation | 127.3 | 129.6 | 127.7 | -6.97 | -0.34 | 127.6 | 123.3 | 120.5 |
| Change in Inventories | 1.0 | 1.6 | 1.3 | -2.6* | -0.3* | 1.6 | 1.4 | 2.0 |
| Exports of Goods and Services | 85.6 | 85.0 | 79.7 | 3.07 | 7.38 | 80.6 | 73.5 | 68.8 |
| Imports of Goods & Services | 61.5 | 61.1 | 60.8 | 2.43 | 1.02 | 60.5 | 57.9 | 54.7 |
| ECONOMY WATCHERS SURVEY | Aug 07 | Jul 07 | Aug 06 | Q/Q Chg | Y/Y Chg | 2006 | 2005 | 2004 |
| Current Conditions (%) | 44.1 | 44.7 | 46.8 | -0.6* | -2.7* | 51.4 | 50.3 | 50.0 |
| Future Conditions (%) | 46.5 | 46.7 | 50.0 | -0.2* | -3.5* | 52.9 | 51.5 | 51.4 |
| * Differences | ||||||||
More Economy in Brief
 Global| Feb 05 2026
Charts of the Week: Balanced Policy, Resilient Data and AI Narratives
by:Andrew Cates


