 Global| Sep 17 2007
Baltic Current Account Deficits in the Stratosphere
Summary
The current account deficits in the three Baltic countries, Estonia, Latvia and Lithuania have sky rocketed in the last year or so. In the first quarter of this year, Lithuania reported that its current account deficit as a percent of [...]
The current account deficits in the three Baltic countries, Estonia, Latvia and Lithuania have sky rocketed in the last year or so. In the first quarter of this year, Lithuania reported that its current account deficit as a percent of Gross Domestic Product was 12%, For Estonia, the figure was 17% and for Latvia, 27%. The first chart shows the current account deficits as a percentage of GDP for the three countries.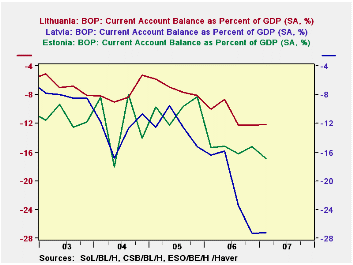
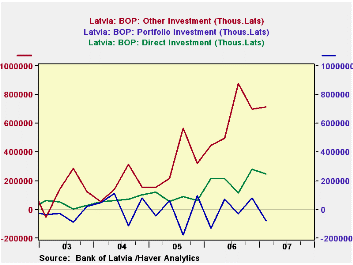
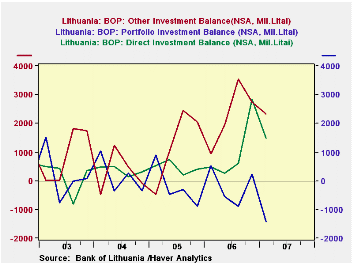
All three countries have experienced high rates of growth largely as a result of increased consumption and residential investments. In all three countries, the net inflow of foreign funds has helped to finance this growth. Of some concern, however, is the predominance of "other investments". These inflows have exceeded the net inflow of both direct and portfolio investments in the last year or so as can be seen in the second, third and fourth charts. The net inflow of "other investments" more than doubled between 2005 and 2006 in Estonia and Latvia and almost doubled in Lithuania. "Other investments," which include, among other things, loans to banks and unaffiliated persons tend to be more short-term oriented and more volatile than either direct or portfolio investment. The fifth chart that shows short-term and long-term "other investment" liabilities for Estonia, the only one of the three countries that reports short and long "other investments".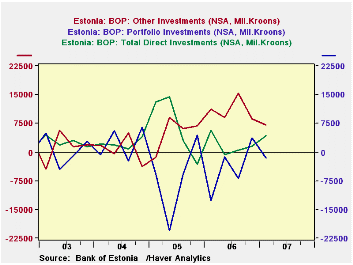
The extraordinarily large deficits have led to a down grading of the ratings on the external debt of these countries. In addition, concerns are being raised regarding the safety of their currencies. Economic trends in these countries can be tracked in the Haver data base EMERGECW and daily changes in the foreign exchange rates can be tracked in the Haver data base INTDAILY. Later this month second quarter data on the balance of payments will be released. 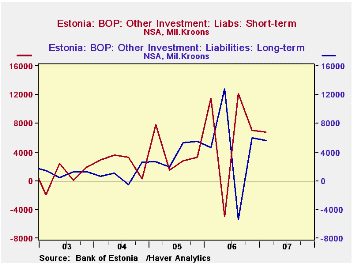
| Q1 2007 | Q4 2006 | Q3 2006 | Q2 2006 | Q1 2006 | Q4 2005 | 2006 | 2005 | |
|---|---|---|---|---|---|---|---|---|
| CURRENT ACCOUNT/GDP (%) | ||||||||
| Estonia | -16.88 | -15.25 | -16.23 | -15.18 | -15.41 | -8.29 | -15.52 | -9.97 |
| Latvia | -27.21 | -27.34 | -23.41 | -15.88 | -16.48 | -15.28 | -20.78 | -12.47 |
| Lithuania | -12.13 | -12.30 | -12.28 | -8.70 | -9.98 | -8.12 | -10.82 | -7.15 |
| NET INFLOW OF "OTHER INVESTMENT" | ||||||||
| Estonia (Mil. Kroon) | 7097.7 | 9600.5 | 15370.6 | 8940.2 | 11118.4 | 6919.17 | 44029.8 | 2053.8 |
| Latvia (Mil. Lats) | 715.4 | 700.1 | 879.3 | 499.4 | 448.8 | 312.3 | 2522.3 | 1261.9 |
| Lithuania (Mil. Litas) | 2334.8 | 2730.2 | 3541.3 | 1933.1 | 936.2 | 2059.5 | 9140.8 | 5063.4 |


