 Global| Aug 24 2010
Belgian Business Leaders More Confident
Summary
Belgian business leaders appear to be shrugging off warnings of an economic slow down. They have expressed more confidence in the economic outlook over the last two months. The National Bank of Belgium's confidence indicator rose from [...]
 Belgian business leaders appear to be shrugging off warnings of an economic slow down. They have expressed more confidence
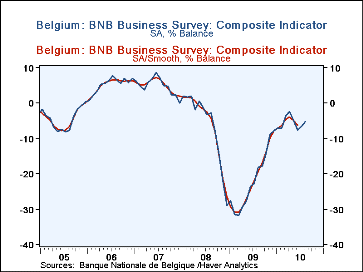
in the economic outlook over the last two months. The National Bank of Belgium's confidence indicator rose from -7.7% in June to -6.5% in July and -5.1% in August
and is now above it's 1980-2010 average.
The National Bank of Belgium's confidence indicator is based on the responses of some 6000 business leaders on present conditions and prospects in their businesses. Results are reported for the manufacturing industry, the construction industry, the trade sector and business related services. These industry results are combined into a composite indicator. The results are presented in the form of percent balances. The Bank also constructs a synthetic curve that eliminates outliers giving a better picture of the underlying trend. That indicator began to turn down in May and continued to decline in June. The composite and the synthetic indicators are shown in the first chart. It is not yet clear whether the July and August increases in confidence will be strong enough to reverse the down trend of the synthetic index.
Confidence has improved in each of the component industries. Optimists have begun to outweigh the pessimists in the trade sector. Over the past thirty years 1980-2010, those with a pessimistic bent tended to outweigh the optimists in all but the service industries. The average percent balance for the manufacturing industry over this period was -11.0%; for the building industry,-7.6%; for trade, -0.9% , for business related services, 12.3%; and for the composite -7.8%. Recent percent balances for the industries are shown in the table below.
| BNB Business Survey (% Balance) | Aug 10 | July 10 | Jun 10 | May 10 | April 10 | Mar 10 | Feb 10 | Jan 10 |
|---|---|---|---|---|---|---|---|---|
| Composite(SA) | -5.1 | -6.8 | -7.7 | -4.9 | -2.4 | -3.6 | -7.0 | -7.0 |
| Composite Smoothed (SA) | -6.2 | -5.0 | -3.9 | -4.5 | -6.2 | -7.2 | ||
| Manufacturing (SA) | -8.1 | -9.5 | -11.2 | -7.8 | -4.5 | -6.5 | -8.6 | -7.2 |
| Construction (SA) | -3.2 | -5.6 | -6.1 | -6.5 | -7.0 | -9.3 | -14.3 | -15.7 |
| Trade (SA) | 1.1 | 0.8 | -3.6 | -0.1 | 1.5 | -1.2 | -4.9 | -9.0 |
| Business Related Services (SA) | 4.1 | 3.1 | 4.7 | 7.9 | 9.7 | 14.1 | 6.7 | 3.1 |
More Economy in Brief
 Global| Feb 05 2026
Charts of the Week: Balanced Policy, Resilient Data and AI Narratives
by:Andrew Cates


